Earlier this year, I wrote my master’s thesis about the flame structure in swirl-stabilized industrial gas turbine burners, the role of fuel staging and the effect of the latter on emissions of nitrogen oxides. A simulation with cantera and Python was used to determine NOx-levels with changing pressure, temperature and fuel staging. In the course of the work, I needed to generature reaction path diagrams of nitrogen. This feature is included in cantera, but creating those diagrams was harder to achieve than I had anticipated. In part, this was due to misleading or missing documentation of cantera. Not only that, it turned out that cantera simply lacks some essential features here. The combination of cantera and the graph visualization tool dot to create those diagrams made it extra confusing, so it took me some time to make cantera and dot do, what I wanted them to do.
As it turned out, not a lot of people have the need to create reaction path diagrams, so there was almost no discussions about it in the Cantera Users‘ Group. But it was essential for me. So I tried to work my way around the pitfalls and was eventually able to come up with some nice looking diagrams. For those of you that face the same problem, this article is for you.
I have written the code in this tutorial initially for cantera 2.2.1 and Python 3.4. For this article, I updated to cantera 2.3.0 and Python 3.6. There were no changes to the reaction path features of cantera in the latest update, so all the code works for the latest versions, respectively. There might be additions to cantera in newer version, and they may render some of the workarounds obsolete. I will try to update this article, but will not promise anything. I encourage you to an open discussion in the Cantera Users‘ Group or the comments here, where you possibly can help others with your input.
What do you need
There are a couple of things you need:
- Python (Reaction path diagrams are not available in cantera for Matlab) – Download here
- Cantera and some other python modules – Find the installation guide here.
- dot (as a part of graphviz) – Download here.
If you are reading this article, you probably came here from a search engine or from the cantera users‘ group. So I assume you already use cantera, that is why I will skip any installation instructions on python or cantera (also, I linked the installation guide above). So let’s start with what you probably don’t already have: dot.
Dot is a description language as well as a tool as part of the Graphviz software package. Graphviz is and open source tool for graph visualization (hence the name) that is used by computer science guys. With dot, you can pretty easily describe a graph, e.g. like this:
digraph graphname {
a -> b -> c;
b -> d;
}
Which turns into a graph like this:
Why am I telling you this? Personally, it always helps me if I really know what I am doing, and why I am doing it. The tool dot that comes with Graphviz is able to understand the notation in the example and can generate graphs like the one above. It is a command line tool that works for Windows, Mac OS and Linux likewise. So, what we are doing is, we use cantera to create the reaction path diagram as dot notation, and after that, we use dot to create the actual diagram. Sounds complicated? It’s not, you’ll see.
Cantera will call dot from the command line, so after you installed graphviz, you need to add dot to your system path variables. For windows users, add the path to dot.exe to the system path variables. The dot.exe can be found in the Graphviz program directory in \release\bin\ or \bin\. So your path should be something like C:\program files\graphviz-2.38\release\bin\. As you probably added python to your system path variables before, this shouldn’t be an issue. If you don’t know how to set your system path variables, please check this link or this one, that should help you.
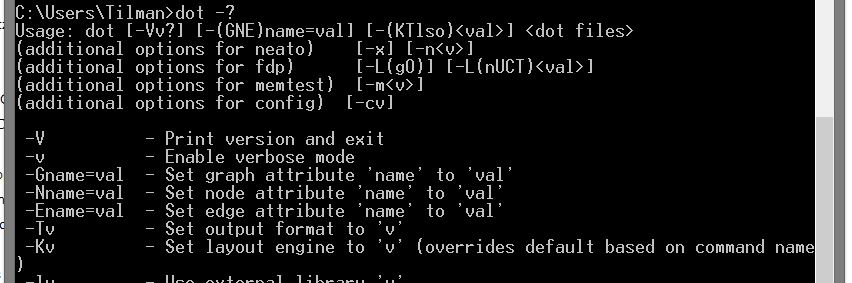
To test if dot is in your system path variables, open a command line window and type dot -?. You should see the dot help screen:
Now you have everything you need, so let’s dive right in:
Creating a Reaction Path Diagram
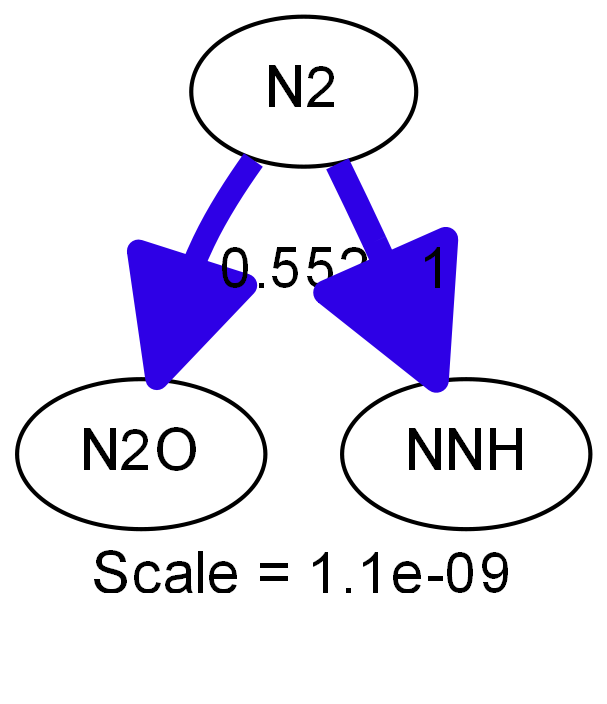
Here is a minimal example with the absolute basics needed to generate a reaction path diagram. It defines a mixture of oxygen, nitrogen and methane at 1500 K and 1 bar and follows nitrogen in the reaction. It creates a .png file of the diagram in the same folder:
"""
Minimal reaction path diagram example
Author: Tilman Bremer
Date: June 21st 2017

Written for Python 3.6 with cantera 2.3.0 but might as well work with other versions.
"""
import os
import cantera as ct

# Define a gas mixture at a high temperature that will undergo a reaction:
gas = ct.Solution('gri30.xml')
gas.TPX = 1500, 100000, 'CH4:0.05,O2:0.21,N2:0.79'

# Define the element to follow in the reaction path diagram:
element = 'N'

# Initiate the reaction path diagram:
diagram = ct.ReactionPathDiagram(gas, element)

# Define the filenames:
dot_file = 'ReactionPathDiagram.dot'
img_file = 'ReactionPathDiagram.png'

# Write the dot-file first, then create the image from the dot-file with customizable
# parameters:
diagram.write_dot(dot_file)

# The last command requires dot to be in your system path variables, or your system
# will not undersand the command "dot".
# The command -Tpng defines the filetype and needs to fit your filename defined above,
# or else you will get errors opening the file later.
# The command -Gdpi sets the resolution of the generated image in dpi.
os.system('dot {0} -Tpng -o{1} -Gdpi=300'.format(dot_file, img_file))
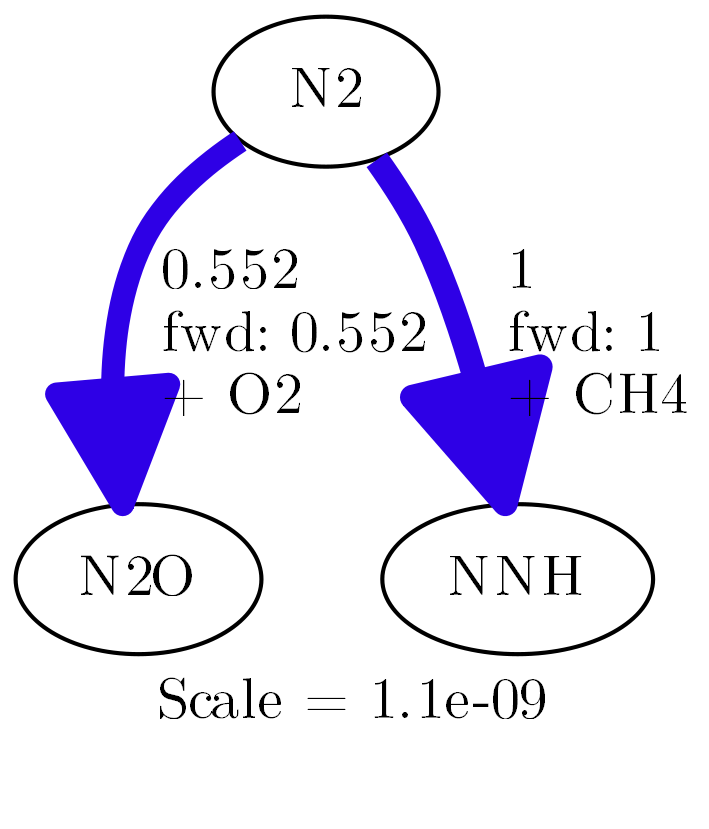
The result are two files, a .dot and a .png file. The .dot file contains the notation as introduced before, as created by cantera:
digraph reaction_paths {
center=1;
s47 -> s37[fontname="Helvetica", style="setlinewidth(5.55)", arrowsize=2.78, color="0.7, 1.05, 0.9"
, label=" 0.552"];
s47 -> s34[fontname="Helvetica", style="setlinewidth(6)", arrowsize=3, color="0.7, 1.5, 0.9"
, label=" 1"];
s34 [ fontname="Helvetica", label="NNH"];
s37 [ fontname="Helvetica", label="N2O"];
s47 [ fontname="Helvetica", label="N2"];
label = "Scale = 1.1e-09\l ";
fontname = "Helvetica";
}
The reaction path diagram looks like this:
That was fairly easy. Now, if you look at the diagram and if you think „that doesn’t look very nice, is there a way to adjust the output?“, I have good and bad news for you. The good news are: There is a way. The bad news: It’s pretty limited, it’s buggy and it won’t do what you expect it to do. So, the next part is for the people like me, that just can’t let it be like it is.
Adjustments with cantera
The problem about adjusting the outcome in form of the reaction path diagram, is that we are dealing with two different softwares now. There are options available to control the dot file generated by cantera, and there are options to control how dot reads the .dot file and generates the actual image.
In the cantera docs, you will find the available options for the ReactionPathDiagram class: http://cantera.org/docs/sphinx/html/cython/kinetics.html?highlight=reaction%20path%20diagram#reaction-path-analysis
Let’s start with easy stuff that works. You can change the font used for the diagram with the font options. In the minimal example above, the diagram was initiated by
# Initiate the reaction path diagram:
diagram = ct.ReactionPathDiagram(gas, element)
So after that, we can define the options by calling diagram. This is what I used to get the Latex serif font:
diagram.font='CMU Serif'
You can let it show details, like this:
diagram.show_details = True
The results looks like this:
If you look into the cantera docs, you will find a whole bunch of options. At first, this looks very promising, until it isn’t. Let me guide you through some of the options:
font |
Works fine. The name of the font needs to match the name of a system installed font. If you are using Windows and would like to use the Latex font, you should install this font. |
bold_color |
Doesn’t do anything. The color, as specified in the dot code as e.g. color="0.7, 1.05, 0.9" (hue, saturation, lightness) is hardcoded in the c++ code of the ReactionPathDiagram export function (if you are interested, see line 342 here). All lines will stay in a blueish color, because hue is hardcoded to 0.7. There were obviously plans to have the user decide the color scheme, but they never saw the light of day. |
dashed_color |
Same as for bold_color |
normal_color |
Same as for bold_color |
scale |
Scaling the fluxes. You can, for example, use diagram.scale = -1 (that is also the default value) to have the largest flux scaled to unity. If you use diagram.scale = 1, you get the correct net fluxes, the unit is kmol/m³s. I am mentioning that, because the unit is not in the docs, but I was told that it is kmol/m³s in the cantera user group.If you would like to remove the label with the scale, it’s not possible with cantera, because cantera hardcodes the label in the dot code (Line 366). However, it is possible with some additional work, see further below. |
title |
Pretty straight forward, it will print a title in the diagram. The title will be printed at the bottom below the scale notice. If you are using the reaction path diagrams in a scientific work, I recommend to add a caption there instead. |
threshold and label_threshold |
These command are working just fine and they are increadibly helpful to clean up the diagram. E.g. you can set diagram.scale=-1 so that the largest flux is unity. Then you set diagram.threshold=0.05 and all fluxes that are smaller than 5 % of the largest flux are removed. This can help you clean your diagram from irrelevant paths. |
flow_type |
Can be either NetFlow or OneWayFlow and it works just fine. Display element fluxes between species both ways or as a summed up net flux. |
dot_options |
That is quite an interesting option. It says in the cantera docs „Get/Set options for the ‘dot’ program“. What it does, is, it will take whatever you provide here and put it the first line of your reaction path dot code. For you to understand what this can do, you need to have a look in the documentation or the guide for dot (yay!). I will go into detail below, but to give you an example, diagram.dot_options='node[fontsize=20,shape="box"]' will change the fontsize and the shape of every node in your diagram. |
write_dot |
This is the final command, because it is the last one you make. This writes the dot code with all options to your specified location so you can then generate the diagram. |
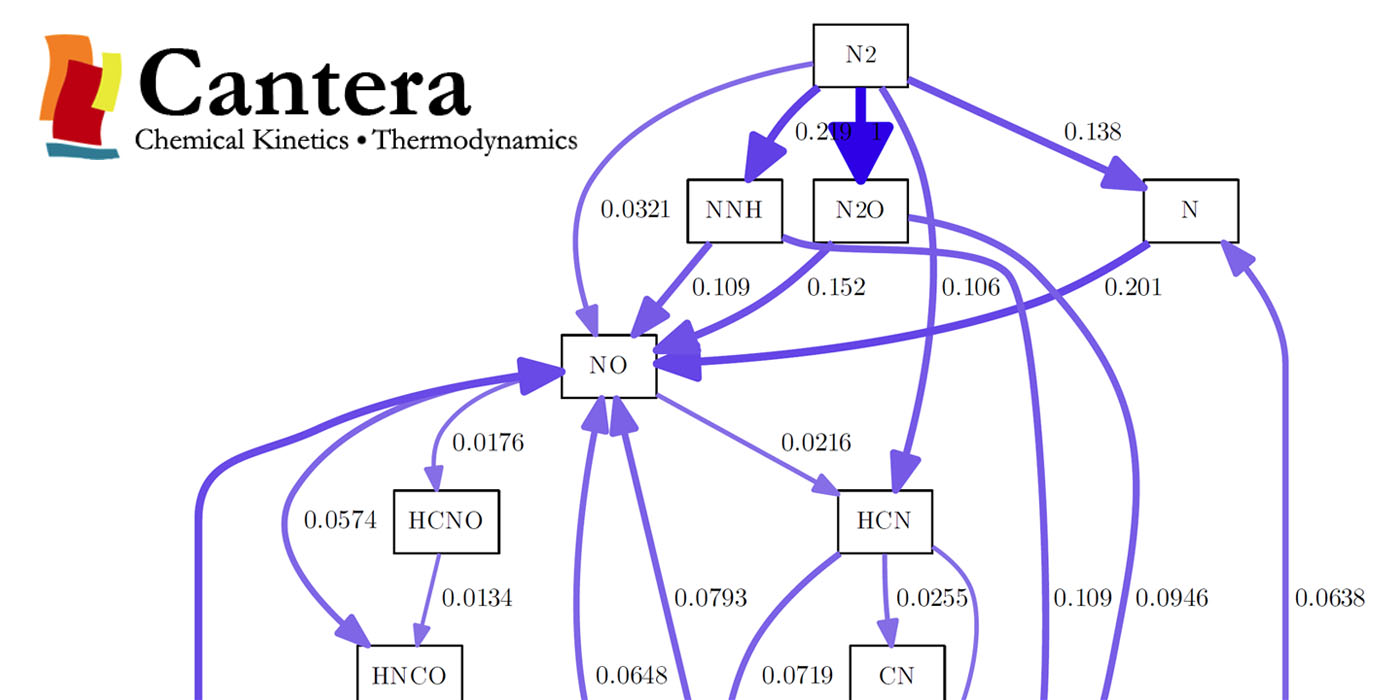
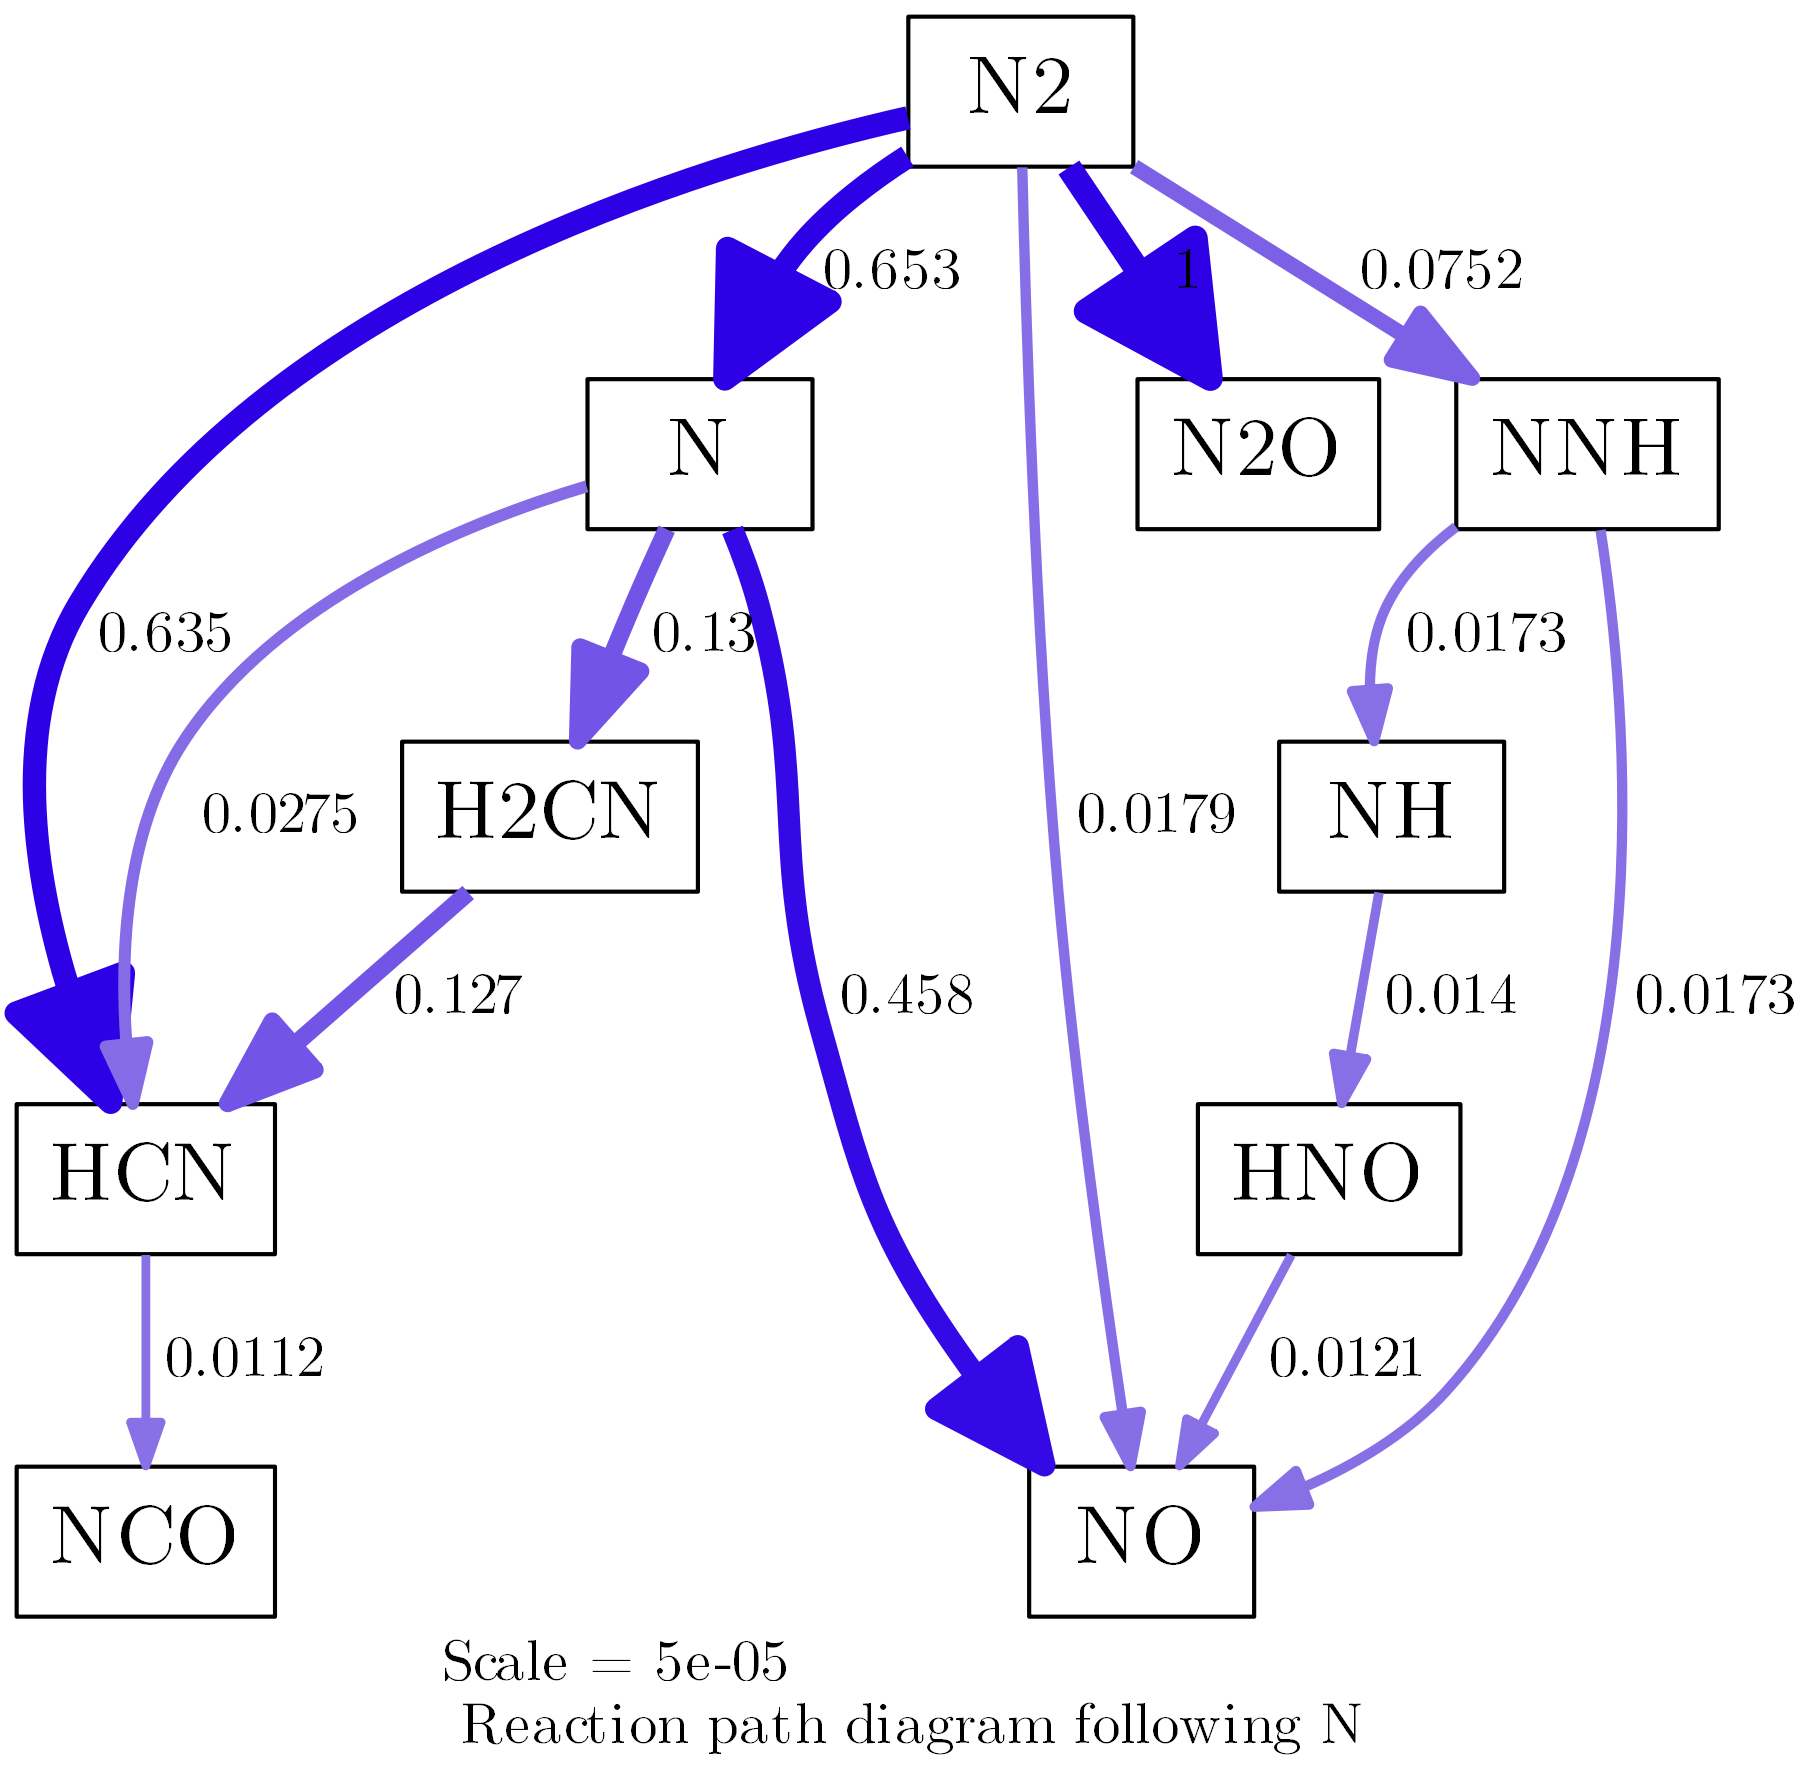
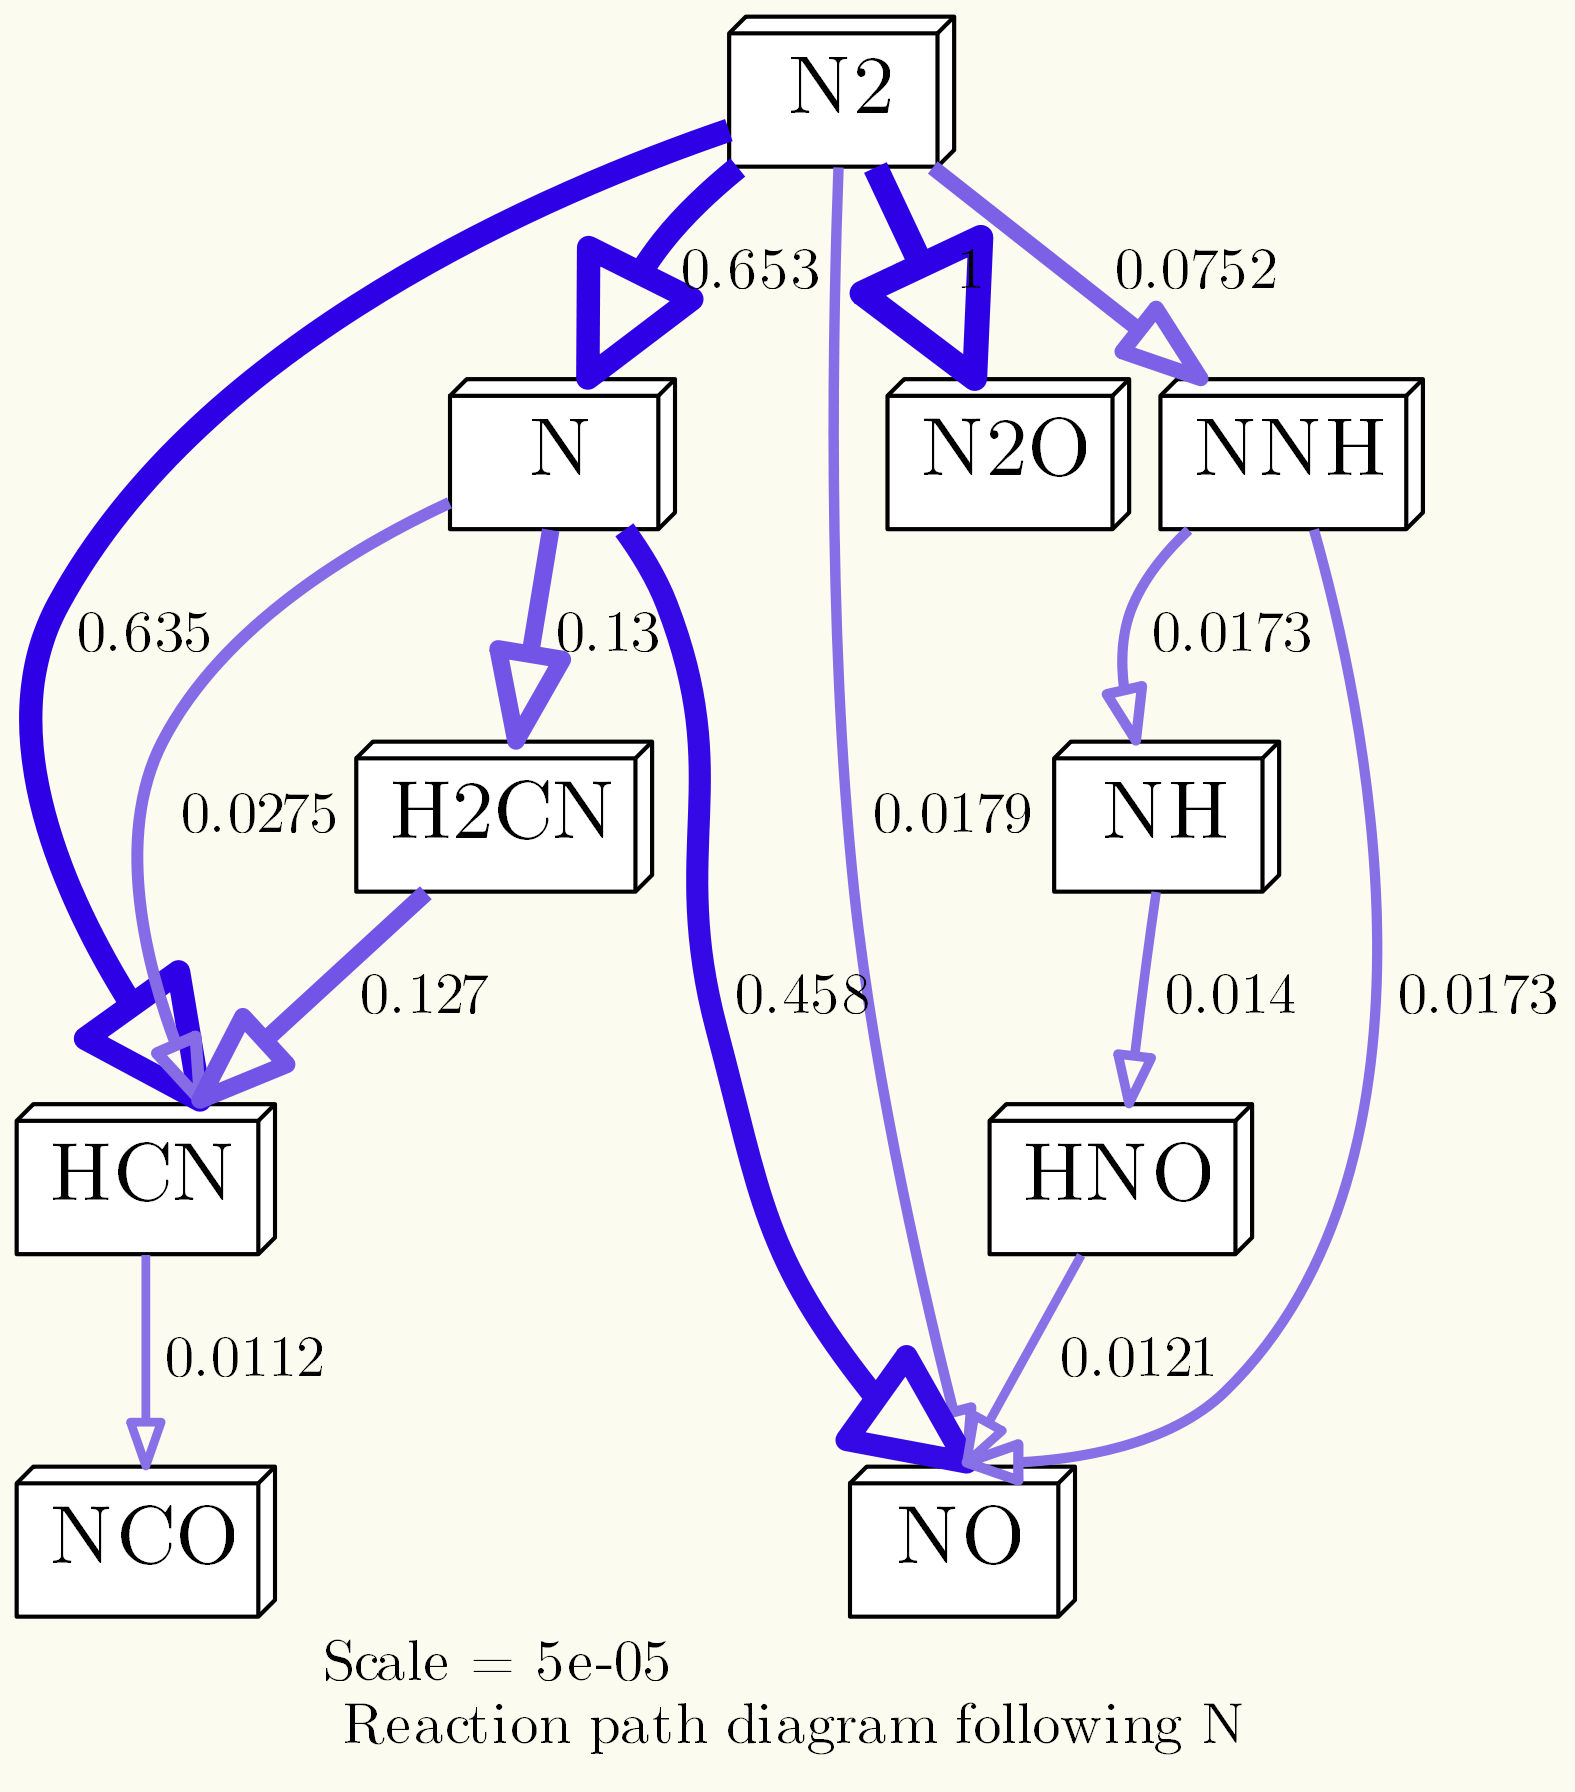
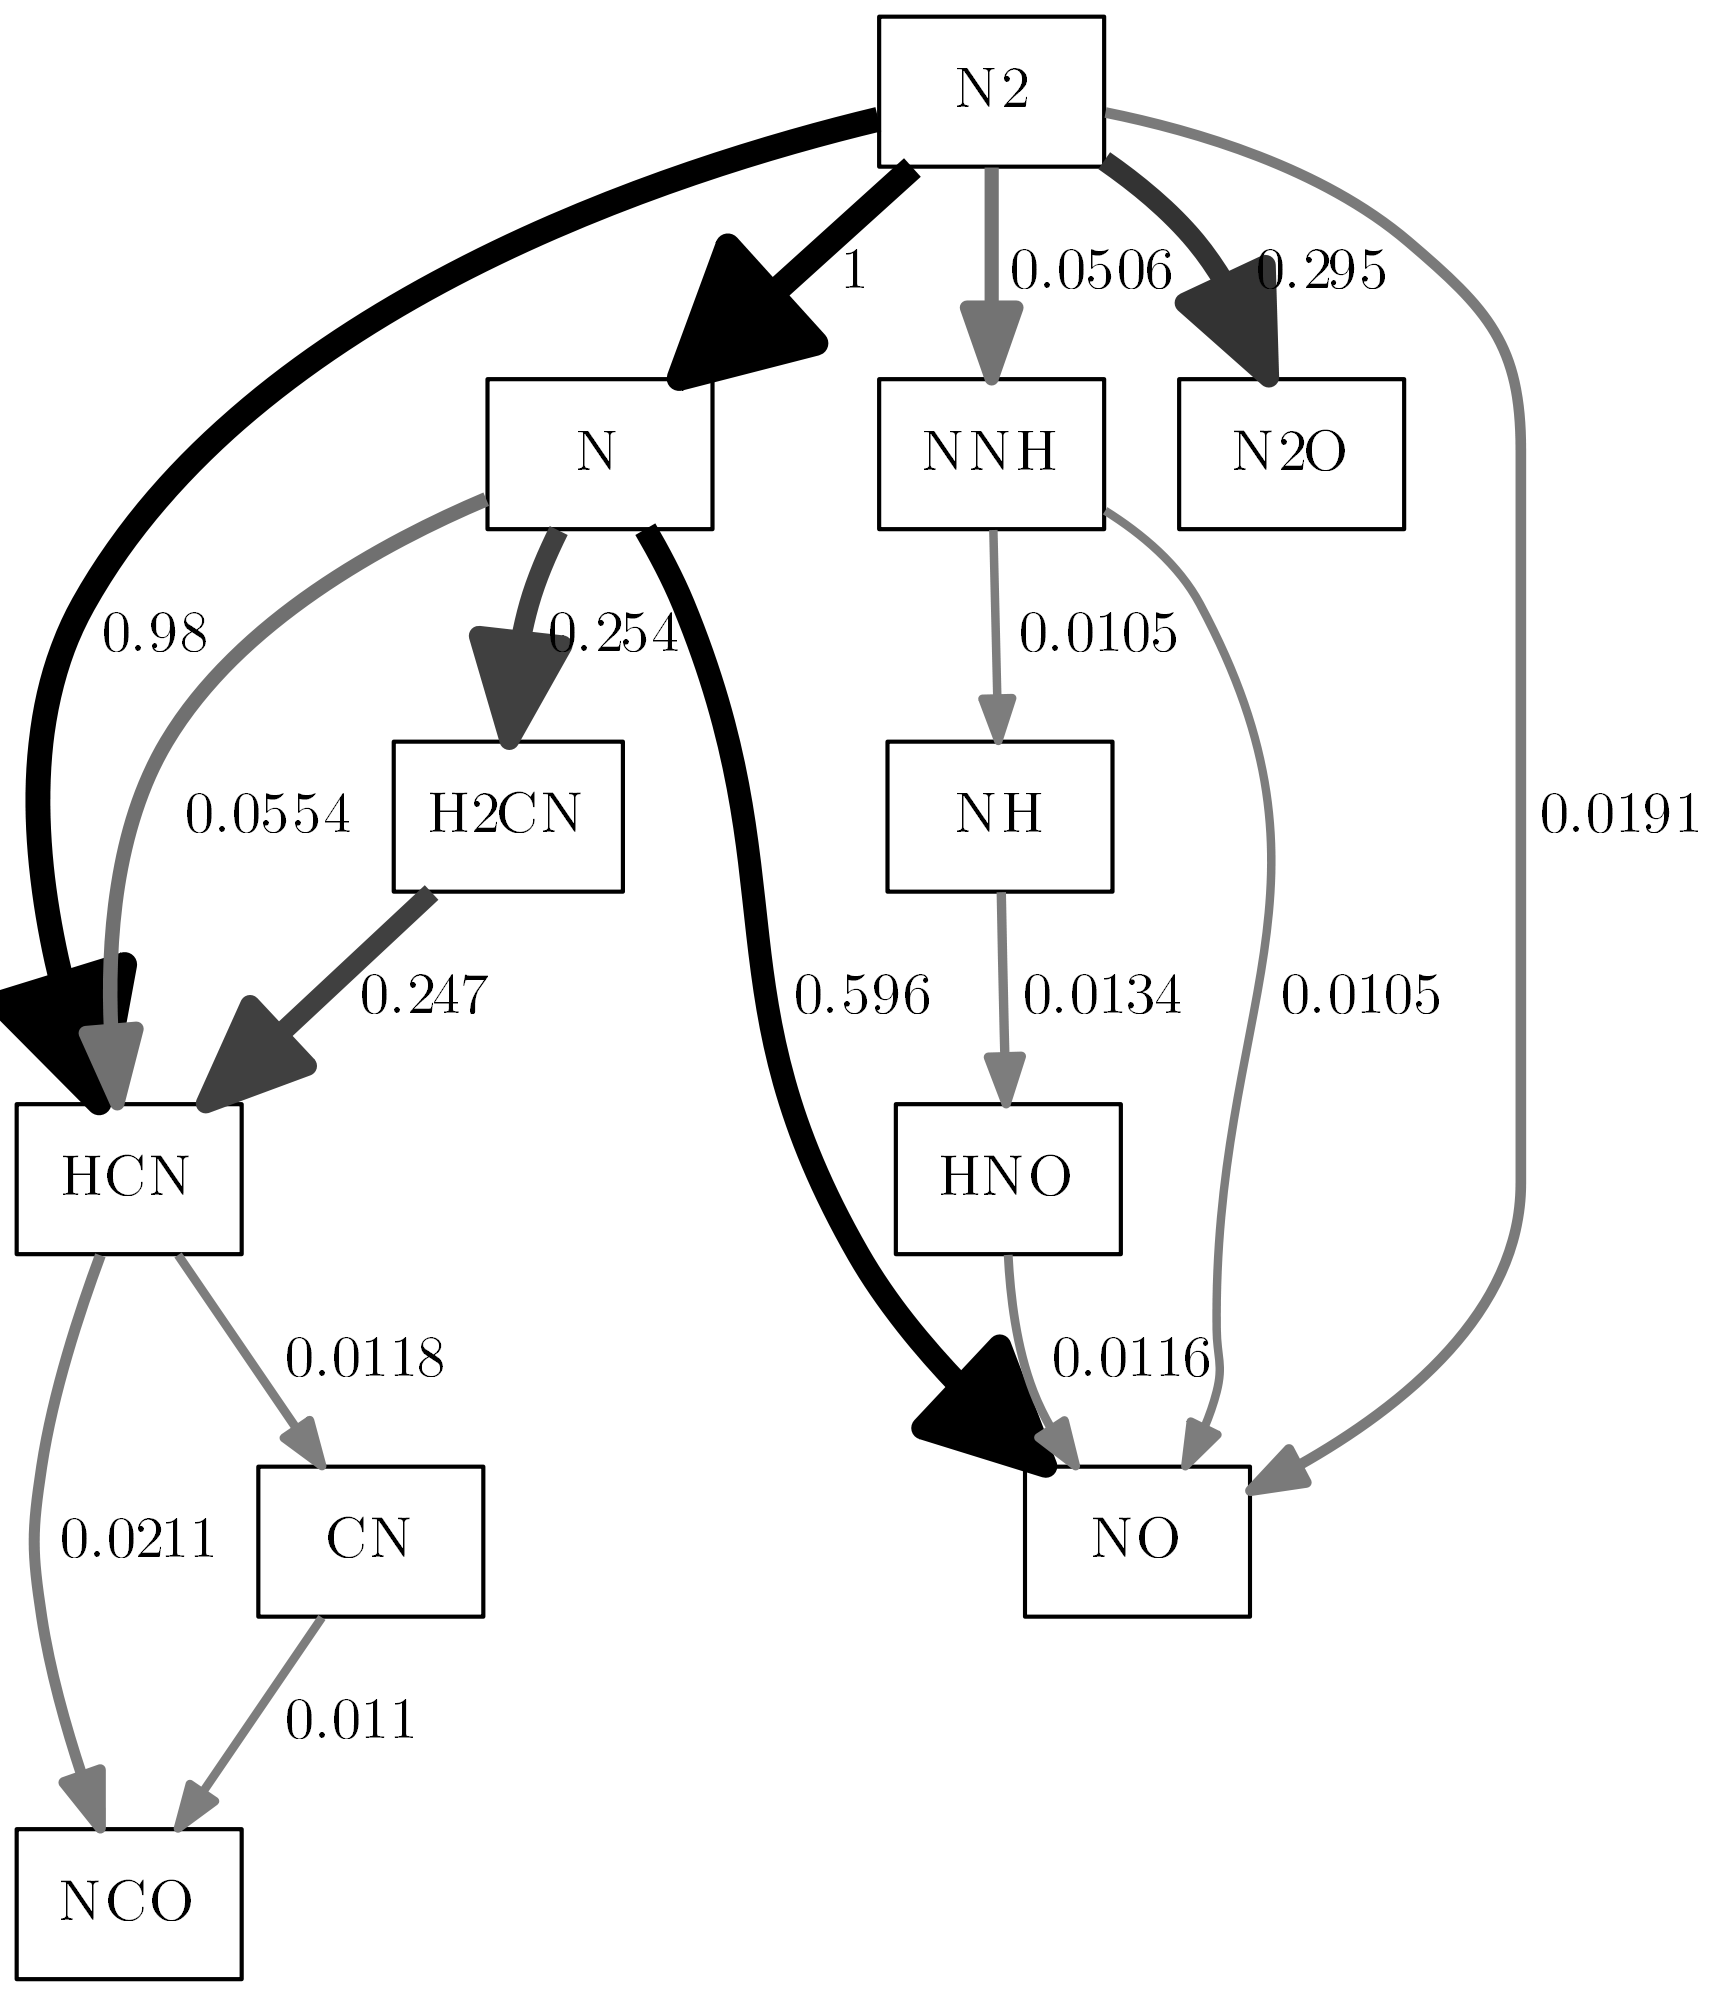
Following is another example of a slightly more complex reaction path diagram. I took the same initial conditions as above, but I included a reactor to let the gas react a little while so it can reach 1800 K, there is time for more species to form and for more reactions to take place. That is also closer to what I did in my master’s thesis. I am not interested in artificial reaction paths but in the ones, that exist at a certain moment in my reactor in a certain state. Due to the high initial temperature, we have self-ignition and a lot of reactions happening, quite fast:
"""
Reaction path diagram example with some options
Author: Tilman Bremer
Date: June 29th 2017

Written for Python 3.6 with cantera 2.3.0 but might as well work with other versions.
"""
import os
import cantera as ct

# Define a gas mixture at a high temperature that will undergo a reaction:
gas = ct.Solution('gri30.xml')
gas.TPX = 1500, 100000, 'CH4:0.05,O2:0.21,N2:0.79'

# Define a reactor, let it react until the temperature reaches 1800 K:
r = ct.IdealGasReactor(gas)
net = ct.ReactorNet([r])
T = r.T
while T < 1800:
net.step()
T = r.T

# Define the element to follow in the reaction path diagram:
element = 'N'

# Initiate the reaction path diagram:
diagram = ct.ReactionPathDiagram(gas, element)

# Options for cantera:
diagram.show_details = False
diagram.font='CMU Serif Roman'
diagram.threshold=0.01
diagram.dot_options='node[fontsize=20,shape="box"]'
diagram.title = 'Reaction path diagram following {0}'.format(element)

# Define the filenames:
dot_file = 'ReactionPathDiagram.dot'
img_file = 'ReactionPathDiagram.png'

# Write the dot-file first, then create the image from the dot-file with customizable
# parameters:
diagram.write_dot(dot_file)
# The last command requires dot to be in your system path variables, or your system
# will not undersand the command "dot".
# The command -Tpng defines the filetype and needs to fit your filename defined above,
# or else you will get errors opening the file later.
# The command -Gdpi sets the resolution of the generated image in dpi.
os.system('dot {0} -Gdpi=300 -Tpng -o{1}'.format(dot_file, img_file))
The result:
Adjustments with dot
As I have shown, some styling is possible with cantera, but not really a lot. You will now understand why I introduced dot in the beginning, because everything else has to come from and has to go into dot code. dot is a powerful tool, so you can style your reaction path diagram in almost every detail, as long as you care to learn a little bit about dot.
There are two ways to adjust the reaction path diagram using dot commands. The first one is mentioned in the table above in the description for the dot_options command and line 33 of the example right above. The second one is the last line of both presented examples:
os.system('dot {0} -Gdpi=300 -Tpng -o{1}'.format(dot_file, img_file))
This line just calls the command line of your system, replaces {0} and {1} with the path to the dot_file and the img_file and executes the line dot {0} -Gdpi=300 -Tpng -o{1}. -Gdpi=300 and -Tpng are command-line options for dot. There are a couple of command line options, all can can be found on page 7 of this document. What you need to know is, that the commands consist of a first uppercase letter to define a command group and the actual command in lower case:
-T... |
File output formats |
-G... |
Graph attributes |
-N... |
Node attributes |
-E... |
Edge attributes |
To give you an example: If you use -Tpdf instead of -Tpng dot will create a pdf version of the reaction path diagram. But you need to change the filename accordingly. So, simply change line 38 to
img_file = 'ReactionPathDiagram.pdf'
and line 48 to
os.system('dot {0} -Gdpi=300 -Tpdf -o{1}'.format(dot_file, img_file))
And you will get a pdf. Or, much cooler: add the -O command to the last line, which will generate the filename automatically depending on the output format you choose. So you can change line 38 to this:
img_file = 'ReactionPathDiagram'
And the last line like this:
os.system('dot {0} -Gdpi=300 -Tpdf -O -o{1}'.format(dot_file, img_file))
Some of the possible commands defining the output file type are: -Tps, -Tpdf, -Tsvg and -Tsvgz, -Tpng, -Tgif, -Tjpg.
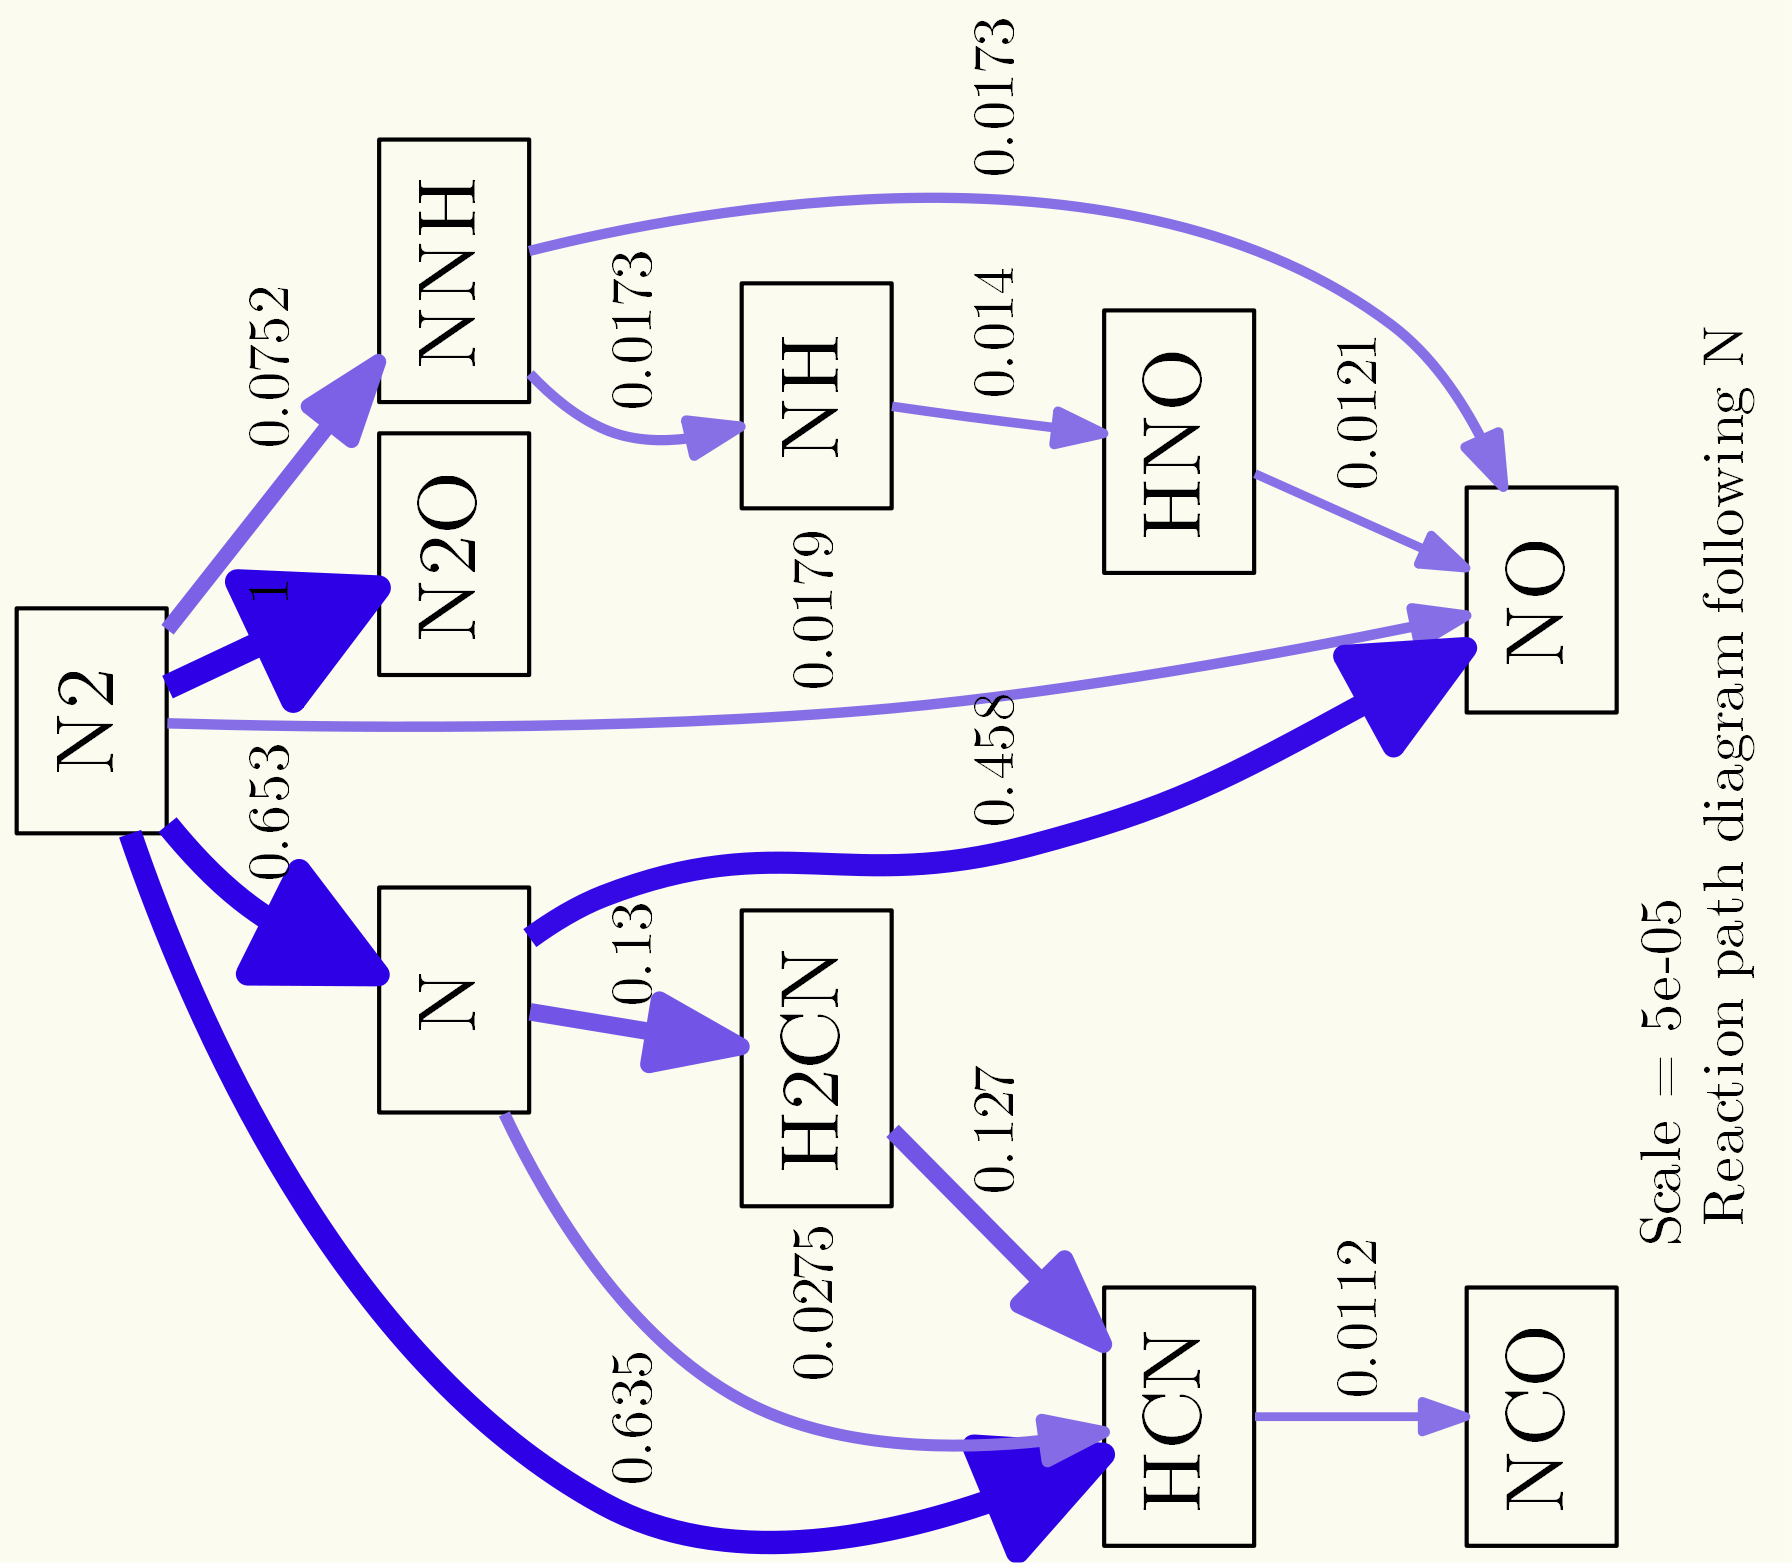
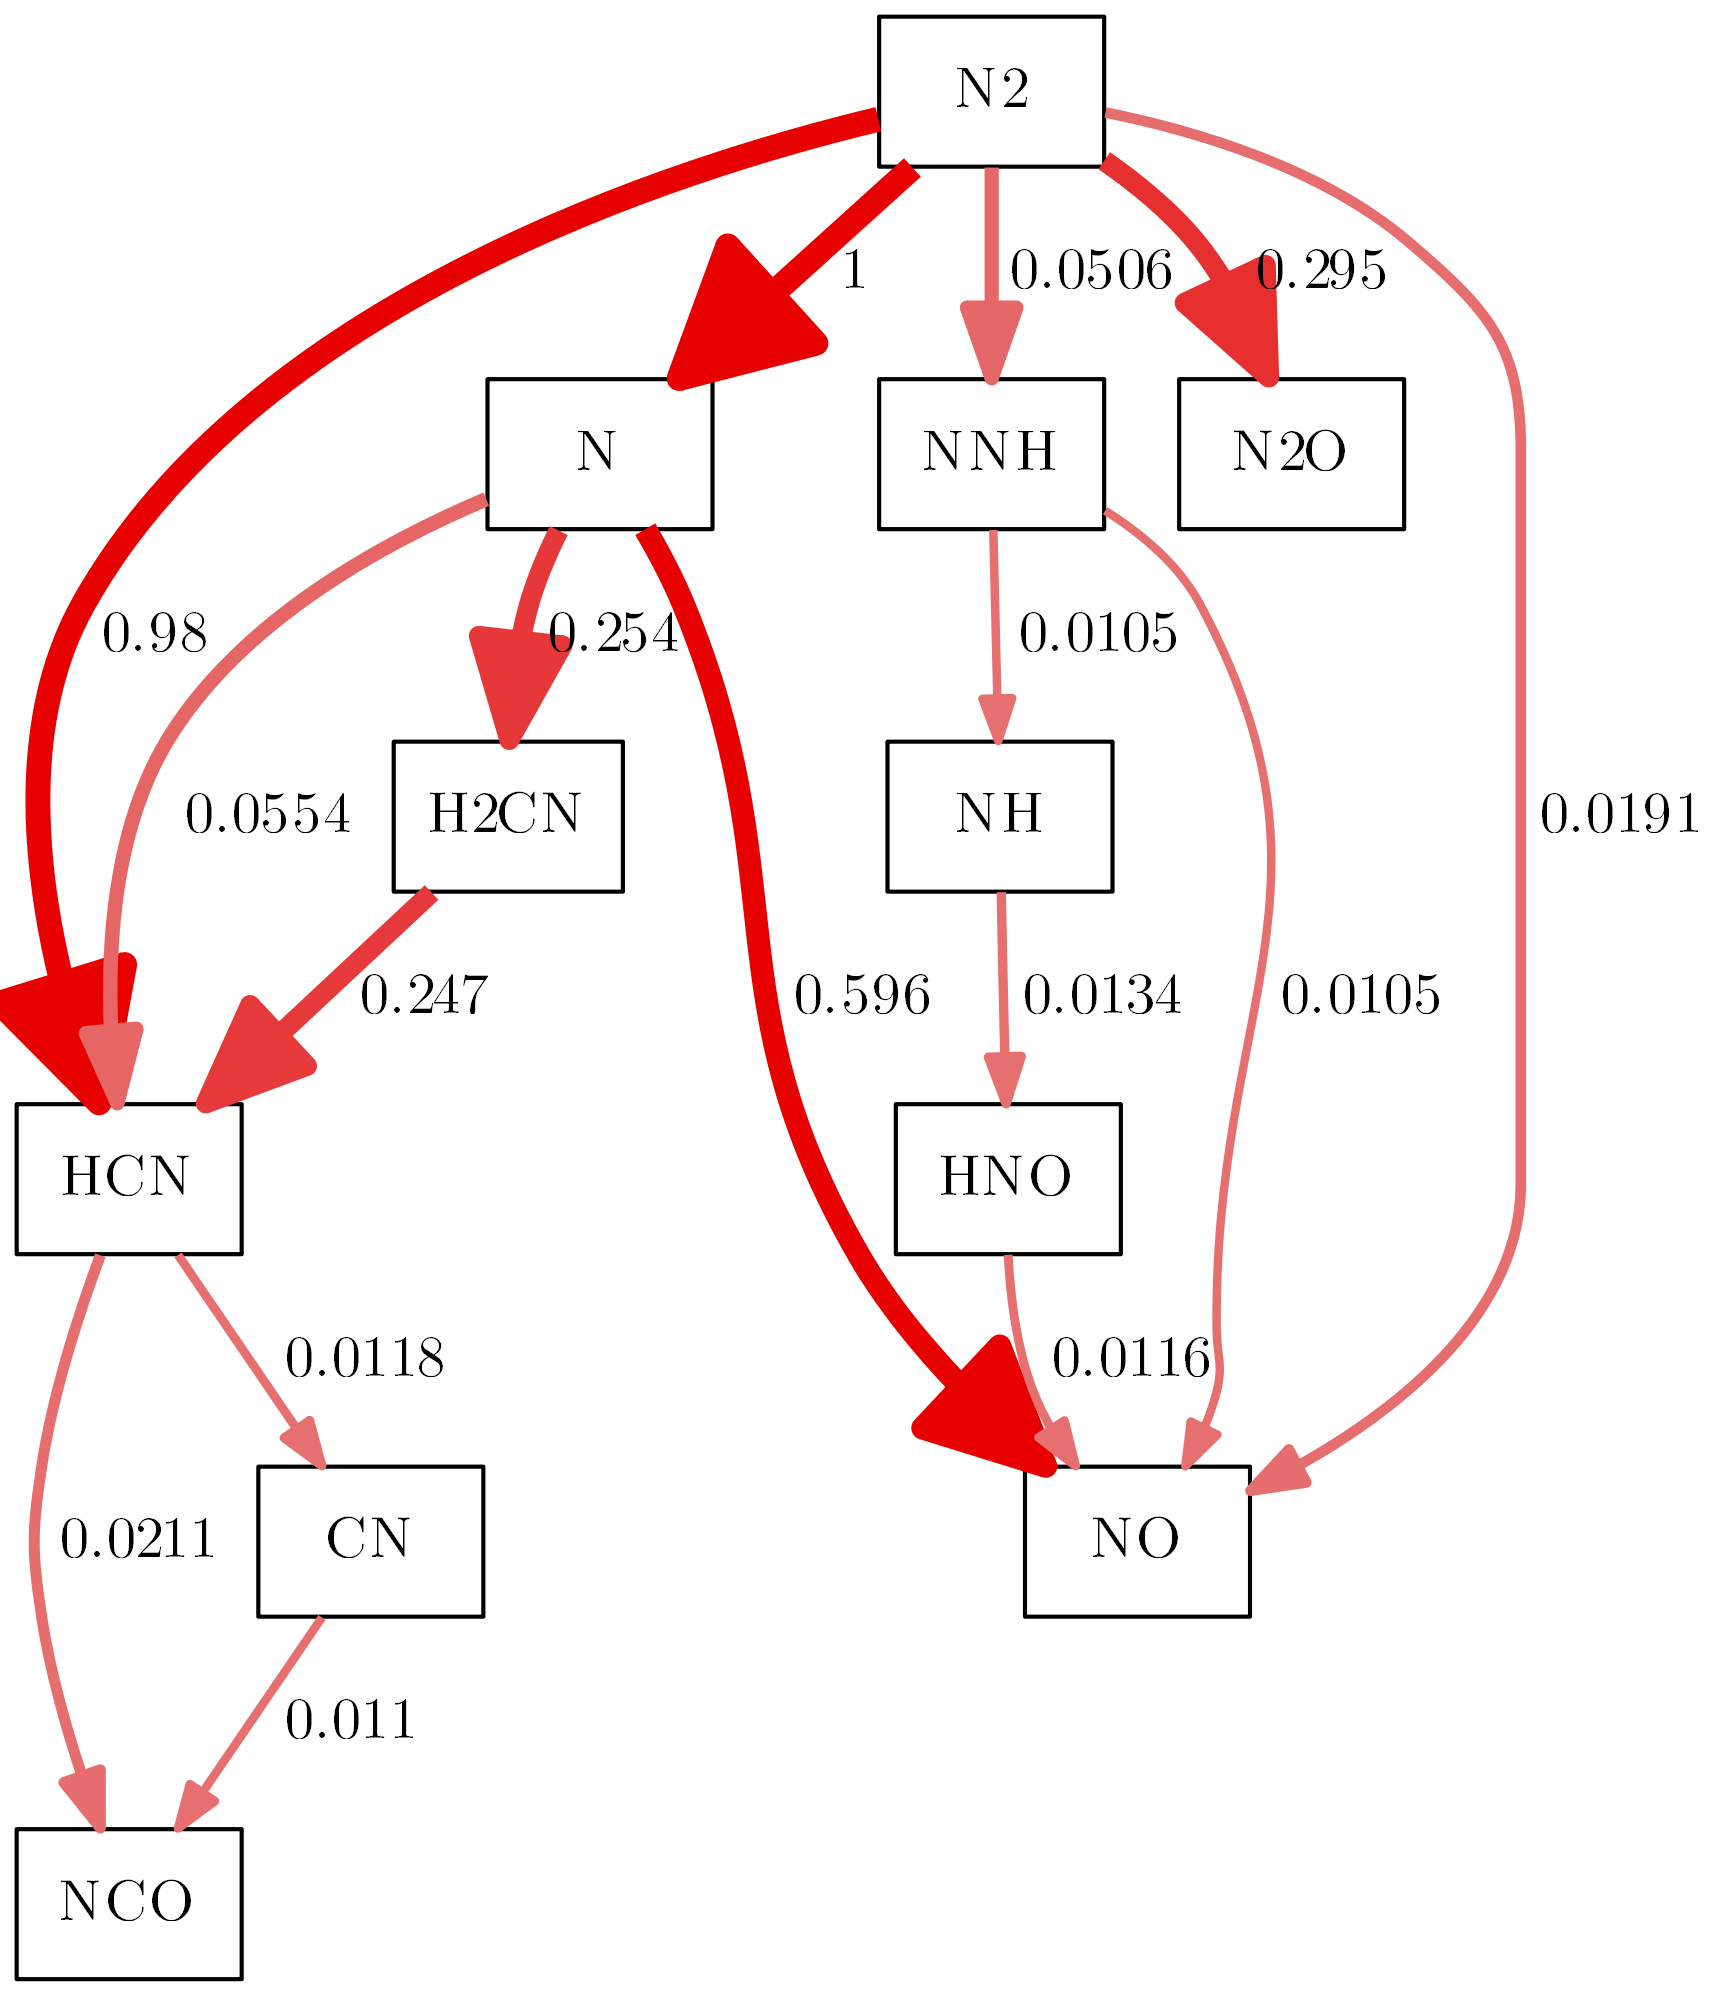
You can adjust the whole graph using the -G commands, to set background colors, rotate the graph, set separation between nodes etc. The command -Gdpi=300 that was in the line the whole time adjust the dpi (dots per inch) resolution of the generated image. Following line is an example, defining the background color to be a light yellow (RGB color code #FBFBEF), reducing the space between the nodes and rotating the image 90° counterclockwise:
os.system('dot {0} -Gdpi=300 -Tpng -Gbgcolor="#FBFBEF" -Grotate=90 -Gnodesep=0.1 -o{1}'.format(dot_file, img_file))
It results in a diagram like this:
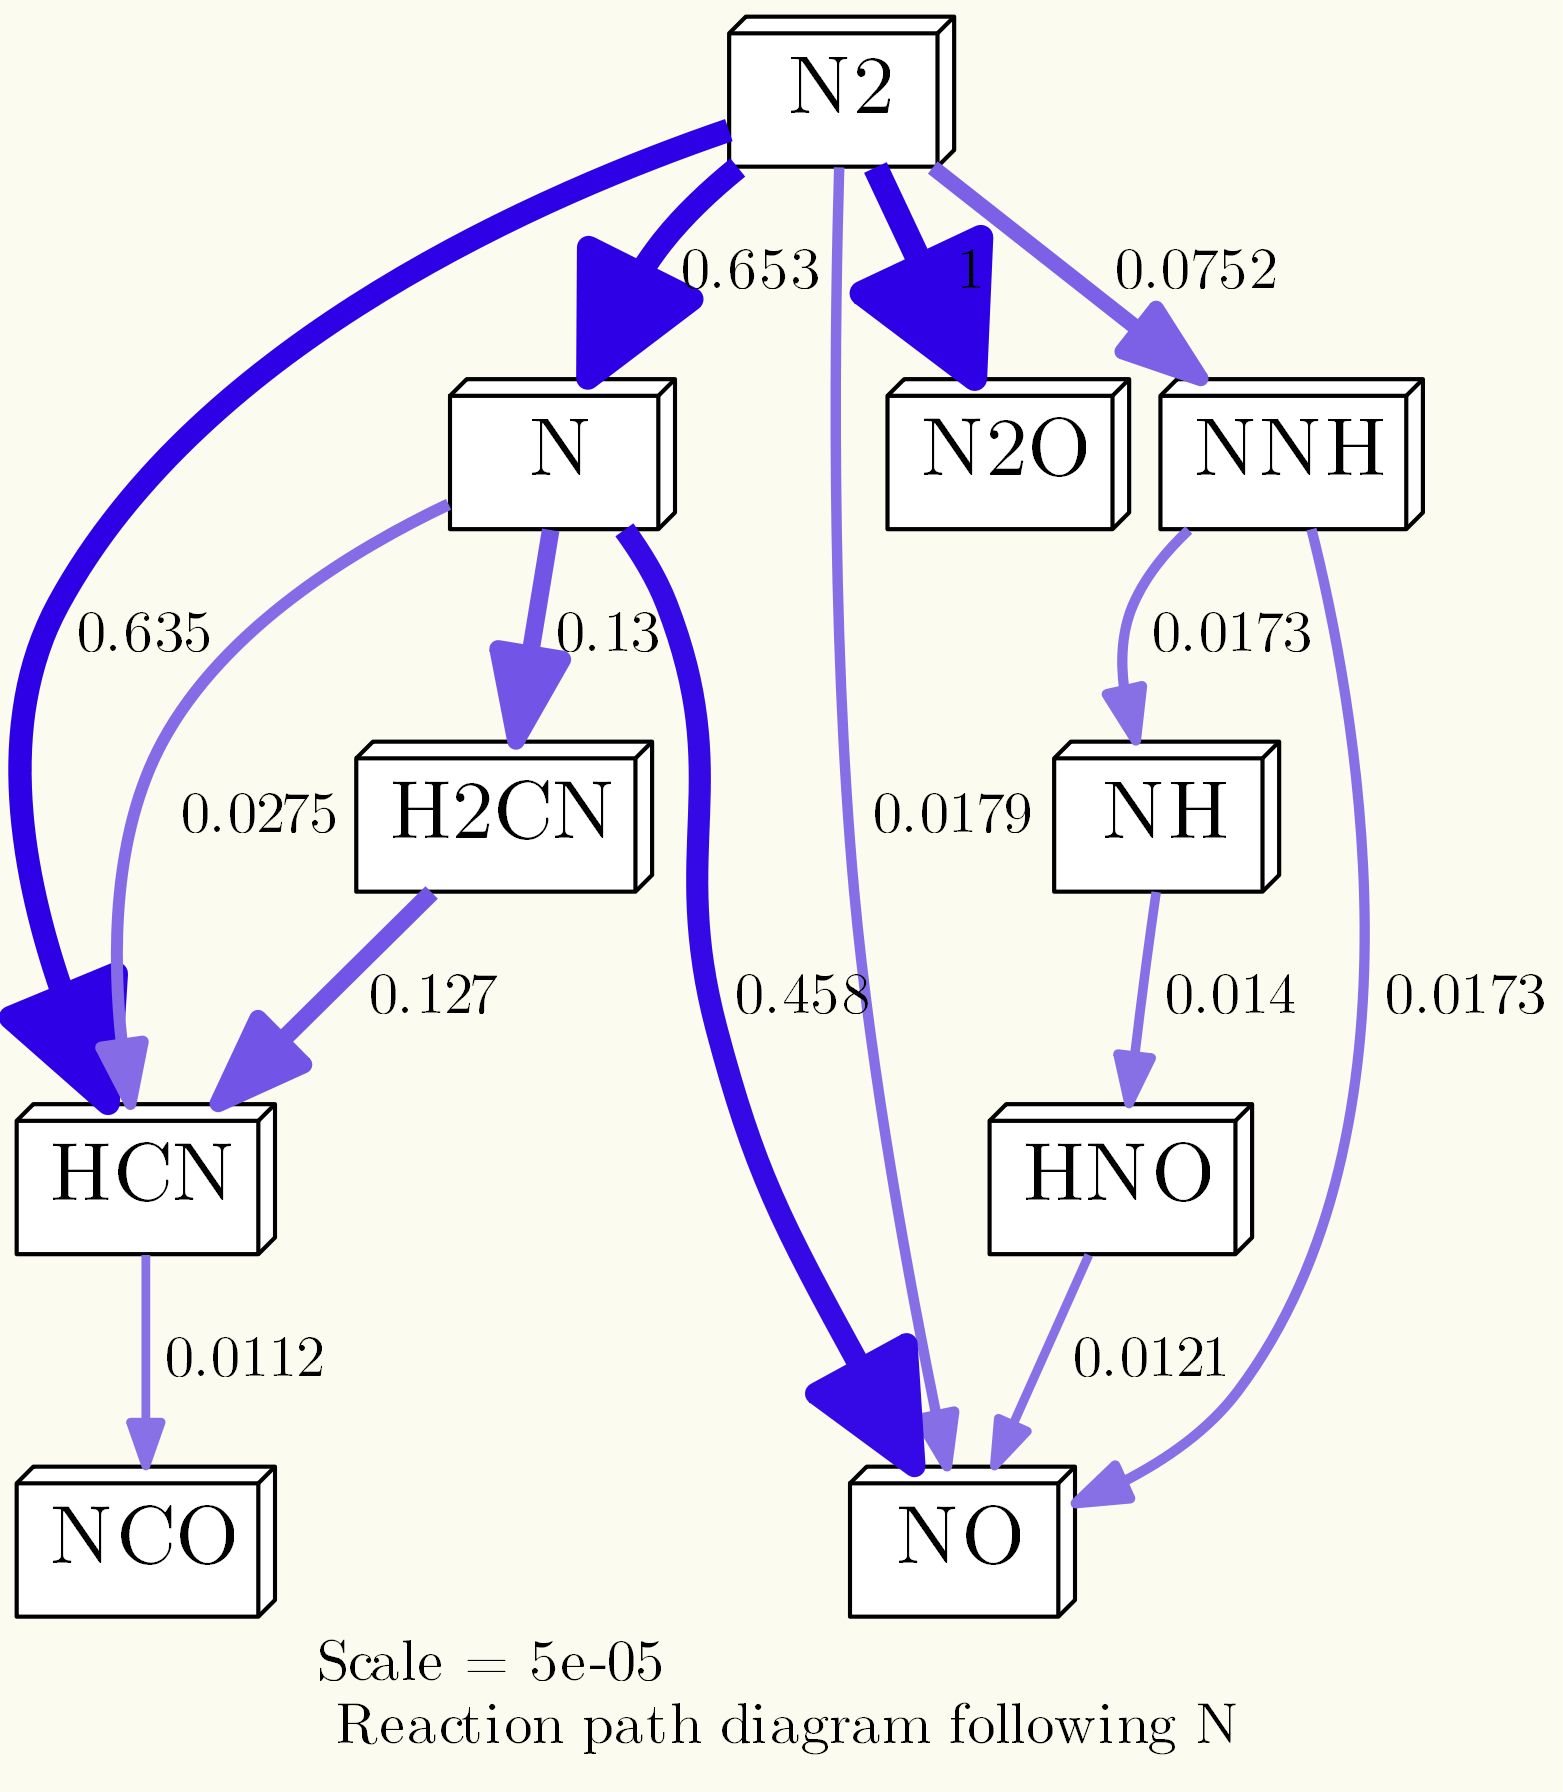
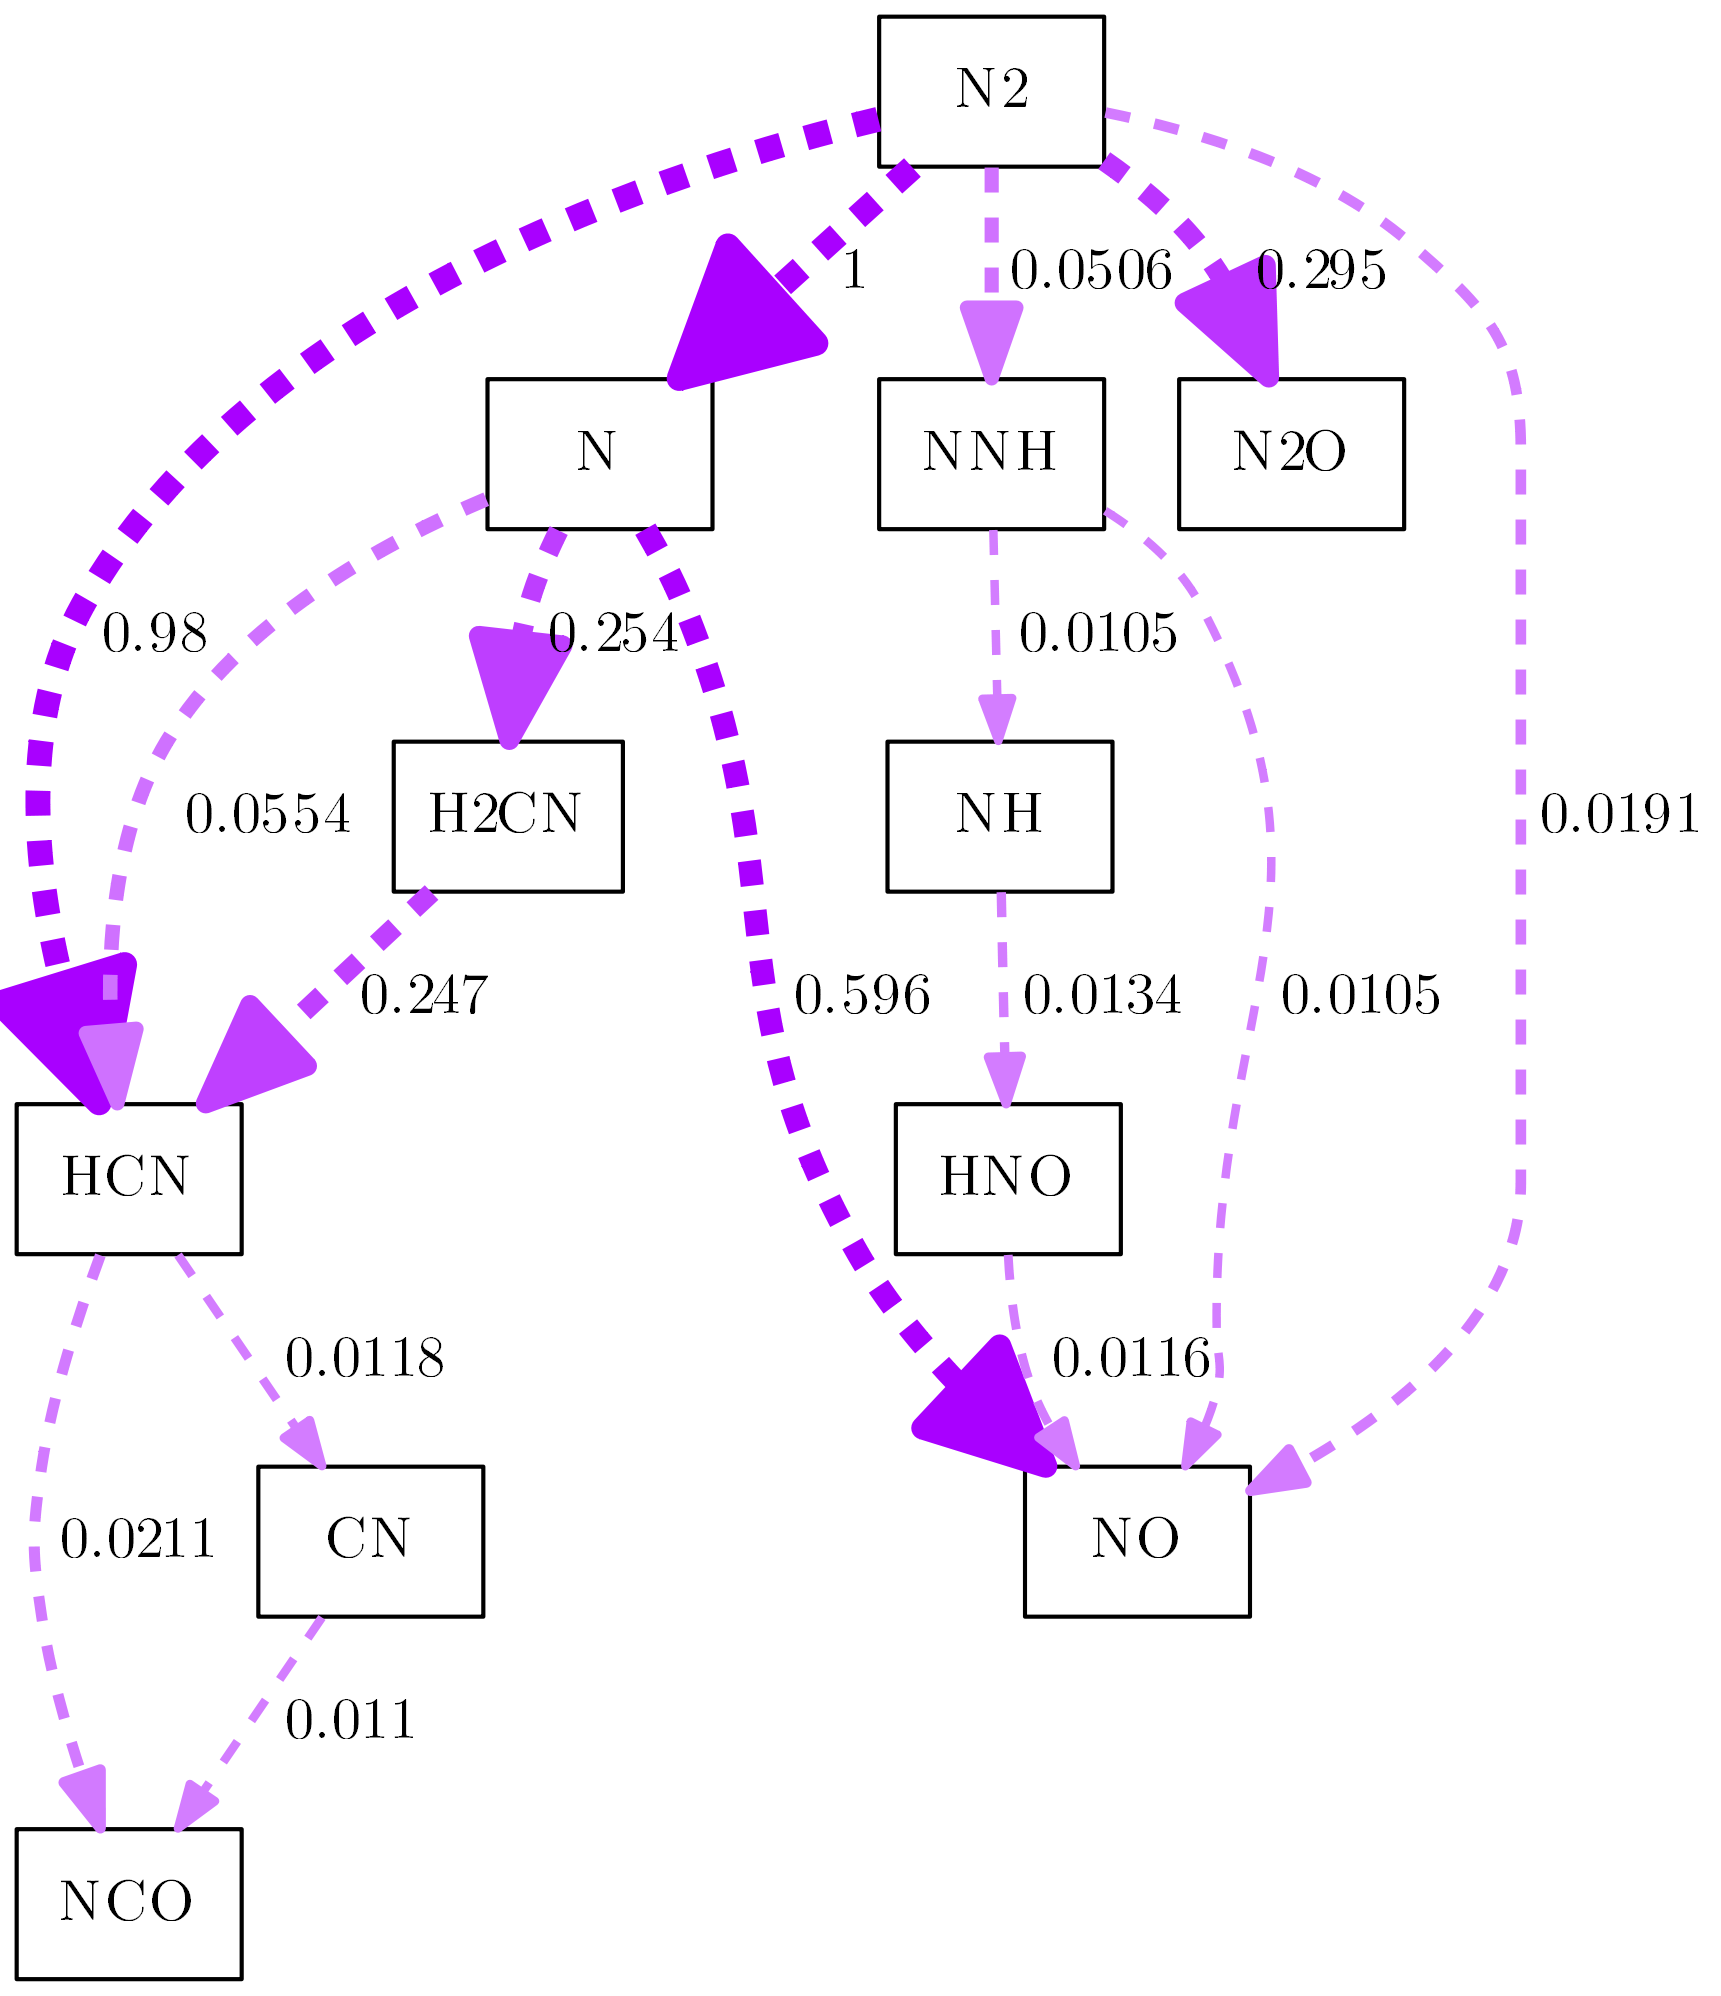
Using the -N commands, you can adjust the style of the nodes. For example, shape, outline and fill color etc. To give you an example (I removed the rotation from the example before):
os.system('dot {0} -Nstyle="filled" -Nfillcolor="white" -Nshape="box3d" -Gdpi=300 -Tpng -Gbgcolor="#FBFBEF" -Gnodesep=0.1 -o{1}'.format(dot_file, img_file))
Okay, this diagram is not getting any prettier, but it is just for the exercise. So, let’s style the edges, too, with the -E commands. The next example contains changed arrows (there is a page just for arrowheads and arrowtails in the dot docs) and sets an option so that all arrowsheads have the same landing points at the nodes:
os.system('dot {0} -Earrowhead="onormal" -Esamehead="true" -Nstyle="filled" -Nfillcolor="white" -Nshape="box3d" -Tpng -Gdpi=300 -Gbgcolor="#FBFBEF" -Gnodesep=0.1 -o{1}'.format(dot_file, img_file))
This is the result:

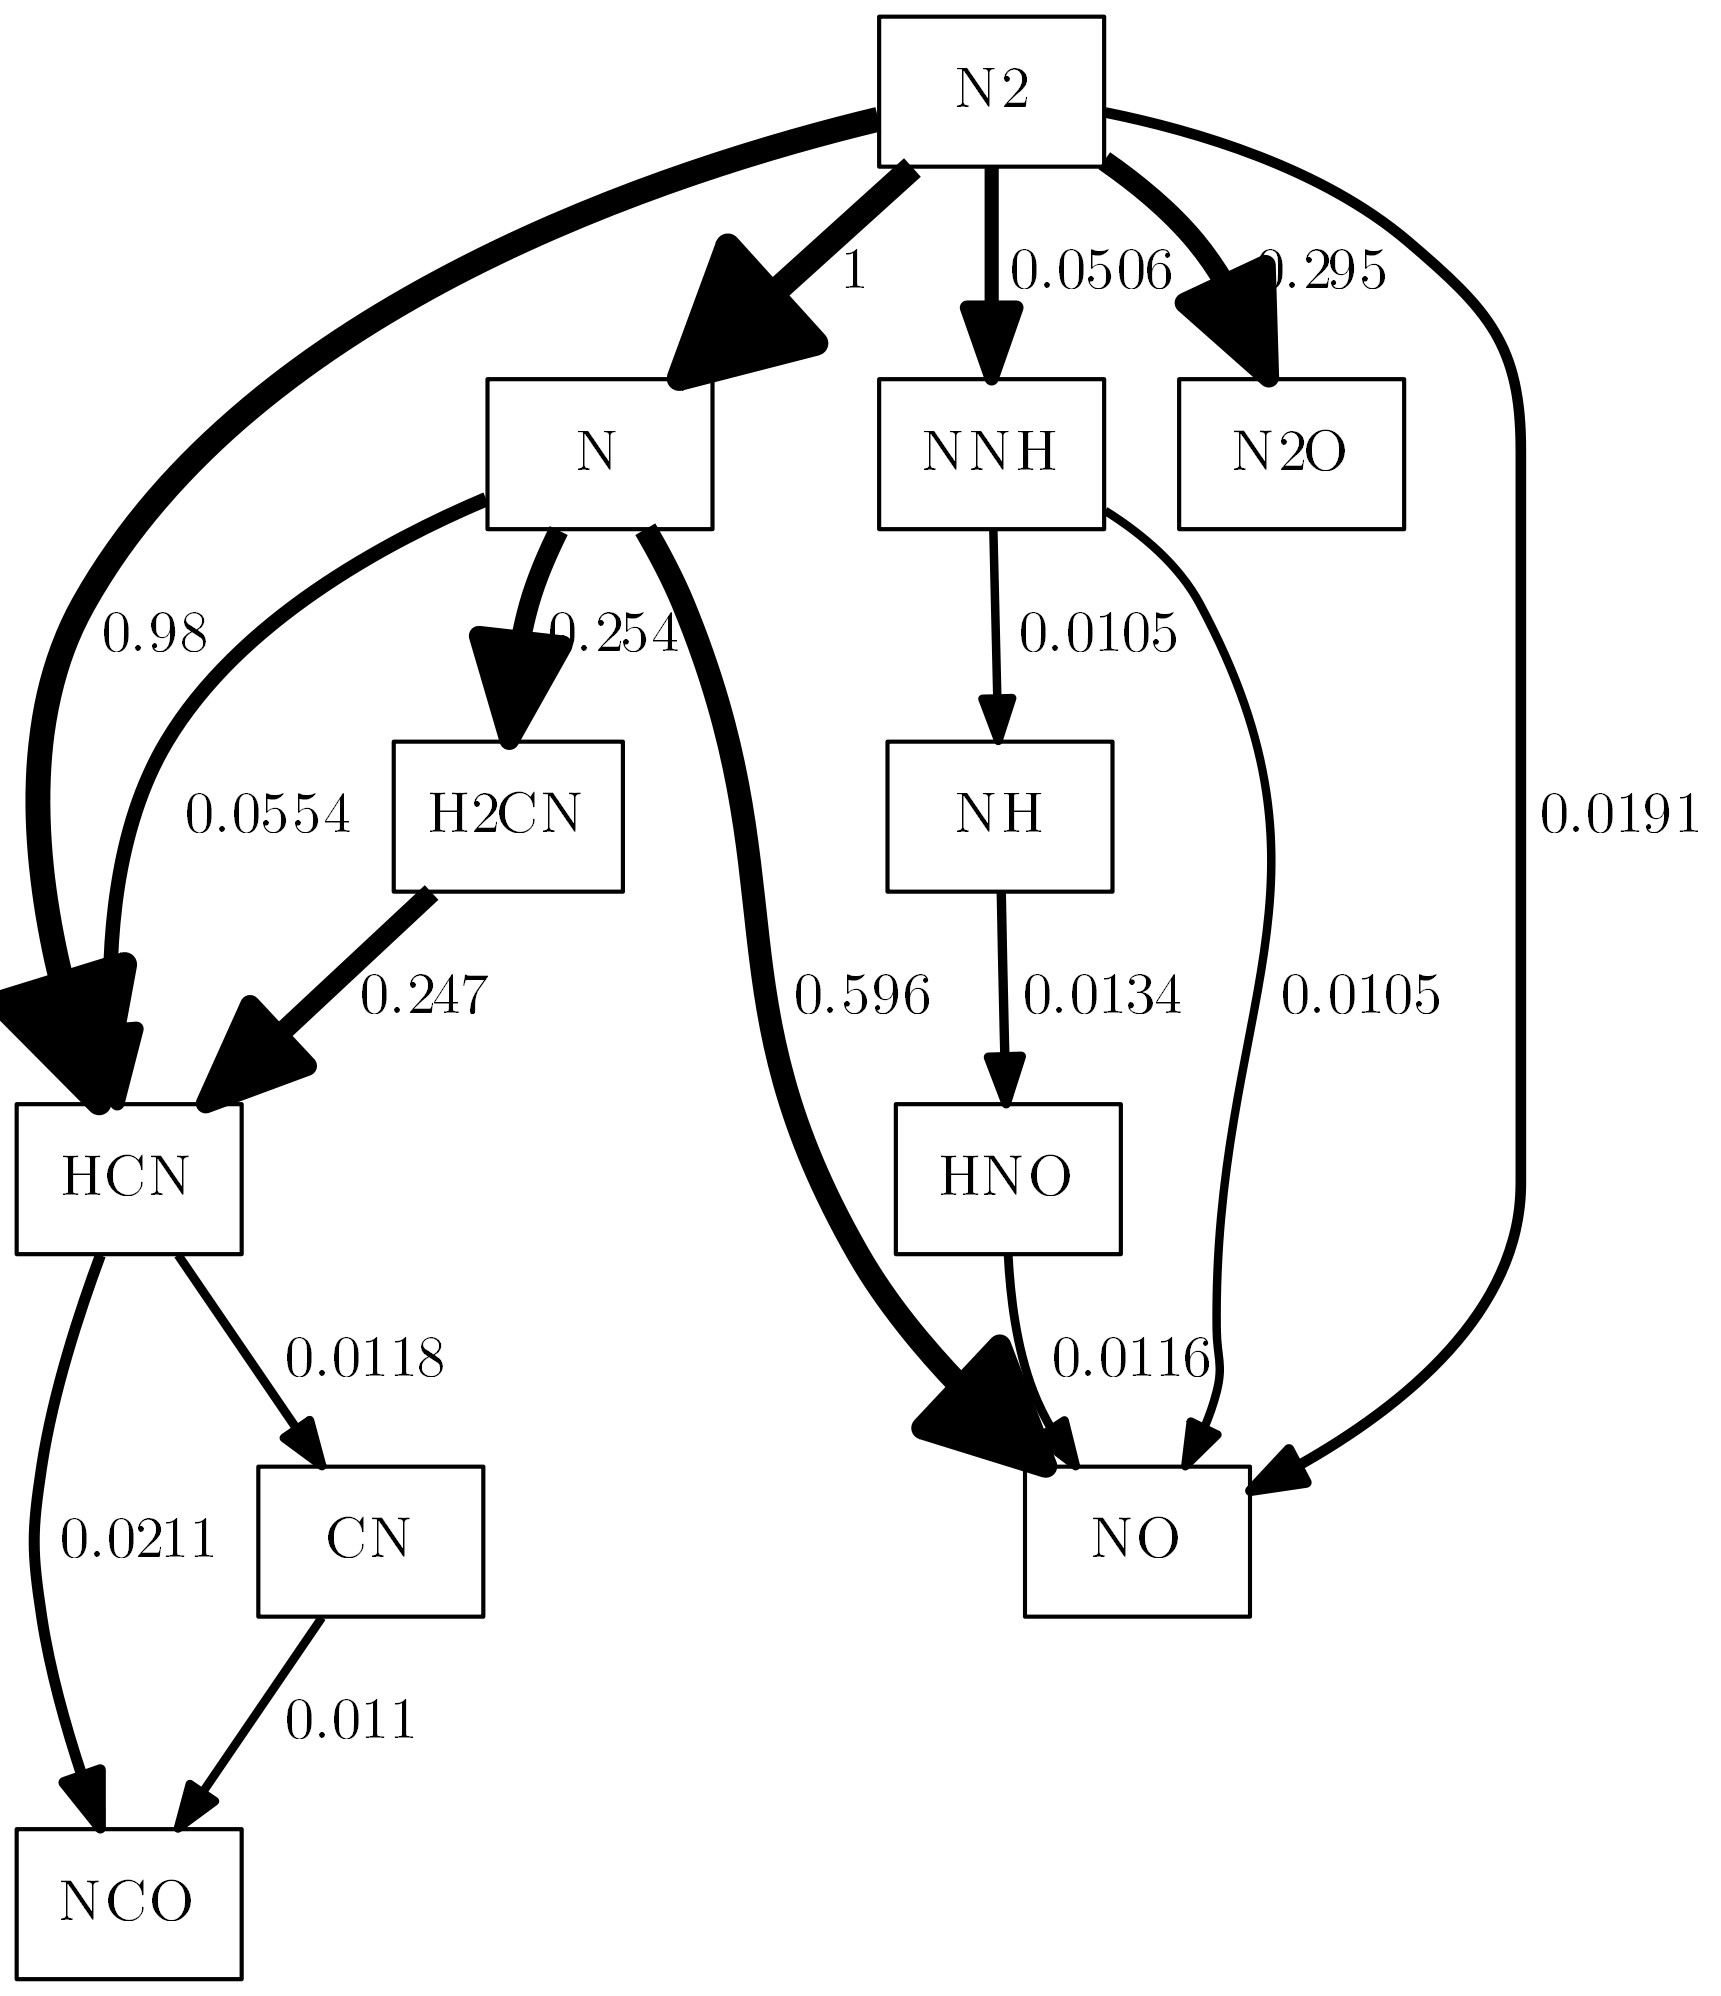
If you kept close attention, you may ask yourself now: „What is the difference between using diagram.dot_options and the command line options?“ Well, there isn’t really one. You can go both ways, but the syntax of the dot_options isn’t as consistent as the command line options, that’s why I don’t like it too much. It is dot’s fault, by the way. As shown earlier, you can provide options for all nodes like this node[option1=value,option2=value,...]. Same goes for options for all edges with edge[...]. For the graph, however, you cannot use graph[...]. Instead, you just have to call the options without identifier, and seperate them with a semicolons instead of commas.
The command line code from the example above can therefore be shortened to
os.system('dot {0} -Tpng -O -o{1}'.format(dot_file, img_file))
when we add an additional line of dot_options like this:
diagram.dot_options='bgcolor="#FBFBEF";nodesep=0.1;dpi=300;node[fontsize=20,shape="box3d",style="filled",fillcolor="white"];edge[arrowhead="onormal",samehead="true"];'
Et voila, same result:
By the way: If you call the same parameter in dot_options and in the command line, the command line will overwrite the settings made in dot_options.
Going deeper
That was all fun, but if you start going through all the layout commands and really dive into dot, you will quickly notice that not all of them will work. Some of them won’t work because the combination of commands is illegal. For example, you can set the node style to dotted or dashed (-Nstyle="dashed"), but this will have no effect if the node style is box3d. It works, however, for all the regular shapes like circle, ellipse, box, etc. Another example: The fillcolor parameter for nodes only works if the style is set to filled and has no effect if style is set to dashed, dotted, etc.
Other things can’t be changed neither with options from cantera, nor with some dot command line options, and that is because some of it is hardcoded in cantera. Here is a list of command line options that will have no effect:
-Ecolor |
The line color depends on the size of the flux and is defined by cantera. |
-Earrowtail |
For reasons I cannot figure out, it seems not to work to have arrowtails in reaction path diagrams from cantera. |
-Earrowsize |
Same as with -Ecolor, the arrow size depends on the flux and is set by cantera. |
-Estyle |
Cannot be set to dashed, dotted, etc., because cantera hardcodes a style argument for every edge in the dot file that is used to define the line width. |
fontname (edges and nodes) |
The font is set by canteras global font parameter, if not, Helvetica is the default font. In any case, cantera writes the font all over the place in the dot code, so you cannot change it individually for nodes or edges. |
„But I want to change the edge color no matter what!“ – Okay Cowboy, if you really want to, there is a way. Follow me.
As we create dot code with every run and then process the dot code with the command line in the os.system command, we need to adjust the dot code before processing. That is not really a graceful solution, but until there are substantial changes made to cantera, it is the way to go. I will show you a complete working example, where there is a code block for replacements in the old dot file after the diagram.write_dot(dot_file) command that saves a modified dot file. The hue settings of 0.7 (blue) will be replaced by 1.0 (red) in all occurrences (For color values, check http://hslpicker.com/). So the interesting part happens between line 44 and 52:
"""
Reaction path diagram example with post-generation modification of the dot-file
Author: Tilman Bremer
Date: June 30th 2017

Written for Python 3.6 with cantera 2.3.0 but might as well work with other versions.
"""
import os
import cantera as ct

# Define a gas mixture at a high temperature that will undergo a reaction:
gas = ct.Solution('gri30.xml')
gas.TPX = 1500, 100000, 'CH4:0.07,O2:0.21,N2:0.79'

# Define a reactor, let it react until the temperature reaches 1800 K:
r = ct.IdealGasReactor(gas)
net = ct.ReactorNet([r])
T = r.T
while T < 1950:
net.step()
T = r.T

# Define the element to follow in the reaction path diagram:
element = 'N'

# Initiate the reaction path diagram:
diagram = ct.ReactionPathDiagram(gas, element)

# Options for cantera:
diagram.font='CMU Serif Roman'
diagram.threshold=0.01

# Define the filenames:
dot_file = 'ReactionPathDiagram.dot'
modified_dot_file = 'ReactionPathDiagramModified.dot'
img_file = 'ReactionPathDiagram'

# Write the dot-file first, then create the image from the dot-file with customizable
# parameters:
diagram.write_dot(dot_file)

# Let's open the just created dot file and make so adjustments before generating the image
# The dot_file is opened and read, the adjustements are saved in the modified_dot_file:
with open(modified_dot_file, 'wt') as outfile:
with open(dot_file, 'rt') as infile:
for row in infile:
# Remove the line with the label:
if row.startswith(' label'):
row = ""
# Replace the color statements:
row = row.replace('color="0.7', 'color="1.0')
outfile.write(row)

os.system('dot {0} -Tpng -Gdpi=300 -Nshape="box" -O -o{1}'.format(modified_dot_file, img_file))
This is the result:
And while we are at it: Cantera uses the setlinewidth argument in a style command for every edge. First of all, setlinewidth is deprecated (see here) and was replaced by the penwidth command. While that is not really a problem, the usage of the style command is, because it takes away our chance to style the edges. So we will simply replace all occurrences of the style command completely and replace setlinewidth with penwidth:
row = row.replace('style="setlinewidth(', 'penwidth=')
row = row.replace(')", arrowsize', ', arrowsize')
With the style command gone, you can use -Estyle=dashed in the command line. I changed the color to pink, too, just for fun:
I gotta stop at some point, but one thing I still want to address, because I believe I am not the only one bothered by it. What do we have to do, to create a monochrome reaction path diagram? Maybe you are required to deliver it in grayscales for your document? It’s not as easy as changing the color, because with the hue settings, you can choose a color, but there is no „no color“ hue setting. We can, however, reduce the lightness to zero. That is quite easy to do and provides a reaction path diagram with all black edges. Add a line like this to the replacement block:
row = row.replace(', 0.9"', ', 0.0"')
That was easy, but it would be nicer, if the original change in saturation could be transformed in actual greyscales. We could just switch the saturation and the lightness settings. There is one problem: Bigger arrows in cantera get a higher saturation value, smaller ones get a lower one. If we use these values for lightness, the large arrows will be completely white. I believe the intuitive way is the opposite: Large arrows should be black, smaller ones should be in shades of grey. That is a little bit more complicated to do, but still, let’s do this. Please check the example, I tried to comment enough so that it is clear to understand. I believe the solution is not very efficient, but it does the job:
"""
Reaction path diagram example with extensive dot code manipulations
Author: Tilman Bremer
Date: June 30th 2017

Written for Python 3.6 with cantera 2.3.0 but might as well work with other versions.
"""
import os
import cantera as ct

# Define a gas mixture at a high temperature that will undergo a reaction:
gas = ct.Solution('gri30.xml')
gas.TPX = 1500, 100000, 'CH4:0.07,O2:0.21,N2:0.79'

# Define a reactor, let it react until the temperature reaches 1800 K:
r = ct.IdealGasReactor(gas)
net = ct.ReactorNet([r])
T = r.T
while T < 1950:
net.step()
T = r.T

# Define the element to follow in the reaction path diagram:
element = 'N'

# Initiate the reaction path diagram:
diagram = ct.ReactionPathDiagram(gas, element)

# Options for cantera:
diagram.font='CMU Serif Roman'
diagram.threshold=0.01

# Define the filenames:
dot_file = 'ReactionPathDiagram.dot'
modified_dot_file = 'ReactionPathDiagramModified.dot'
img_file = 'ReactionPathDiagram'

# Write the dot-file first, then create the image from the dot-file with customizable
# parameters:
diagram.write_dot(dot_file)

# Let's open the just created dot file and make so adjustments before generating the image
# The dot_file is opened and read, the adjustements are saved in the modified_dot_file:
with open(modified_dot_file, 'wt') as outfile:
with open(dot_file, 'rt') as infile:
for row in infile:
# Remove the line with the label:
if row.startswith(' label'):
row = ""
# Change lightness to zero, erase style command and replace setlinewidth with penwidth:
row = row.replace(', 0.9"', ', 0.0"')
row = row.replace('style="setlinewidth(', 'penwidth=')
row = row.replace(')", arrowsize', ', arrowsize')
# Find the lines with a color statement:
if row.find('color="0.7, ') != -1:
# Find the position of the saturation value:
start=row.find('color="0.7, ')
end=row.find(', 0.0"')
saturation=float(row[start+12:end])
if saturation > 1:
# The highest values are set to 0 (black):
saturationnew = 0
else:
# All values between 0 and 1 are inverted:
saturationnew=round(abs(saturation-1),2)
# Switch positions between saturation and lightness:
row = row.replace(', 0.0"', '"')
row = row.replace('0.7, ', '0.7, 0.0, ')
# Replace saturation value with new calculated one:
try:
row = row.replace(str(saturation), str(saturationnew))
except NameError:
pass
# Write the adjusted row:
outfile.write(row)
# Call the command line and generate the image:
os.system('dot {0} -Tpng -Gdpi=300 -Nshape="box" -O -o{1}'.format(modified_dot_file, img_file))
The image looks like this:
As far as I know, there is no way to adjust the corners of the strokes generated by dot. I really don’t like the rounded arrow tips. I searched through all the docs, the web, everywhere, and I believe there is just not an option for that. So, what can you do? If you really want to go all the way, you can export the image as .svg and open it in Illustrator/Inkscape etc. Apparently, Illustrator doesn’t recognize the round corners anyway, so it’s all sharp points right after you open it (I am not sure if that is true for all versions). If not, you can definitely do some manual work in most vector graphic programs. You can also make some final adjustments to the image, after all, dot is not perfect with the placement of labels, edges etc. If you export the image as .svg you have to play around with the -Gdpi settings a bit. If you set the value too high, the edges are very slim after opened in Illustrator. The following image was exported with -Gdpi=70, opened in Illustrator, adjusted and saved as .png with 300dpi:
That’s it, folks! That is all I know. May this tutorial help you to understand the cantera features better. If you have any questions, just comment below. And if you found this tutorial helpful, please leave a note. It’s always nice to know that it was worth the time. I would like to thank everbody involved in the development of cantera, after all, it’s an incredibly powerful tool. Also, kudos to the people involved in writing dot. So nice to see how open source software makes stuff like this possible. Without dot, there would likely never be a feature to generate reaction path diagrams in cantera.
If you find errors in the code, please also comment, so that I can fix them!
Here is a summary of all the links in the article:
- https://groups.google.com/forum/#!forum/cantera-users – Cantera Users‘ Group
- https://www.python.org/ – Official Python website
- http://www.cantera.org/docs/sphinx/html/install.html – Cantera installation guide
- https://www.java.com/en/download/help/path.xml – Setting system path variables 1
- https://www.howtogeek.com/118594/how-to-edit-your-system-path-for-easy-command-line-access/ – Setting system path variables 2
- http://cantera.org/docs/sphinx/html/cython/kinetics.html?highlight=reaction%20path%20diagram#reaction-path-analysis – Options for the
ReactionPathDiagramclass of cantera - https://www.fontsquirrel.com/fonts/computer-modern – Latex fonts
- http://www.cantera.org/docs/doxygen/html/ReactionPath_8cpp_source.html – C++ source code of the
ReactionPathDiagramclass of cantera - https://groups.google.com/d/topic/cantera-users/HbBJDoxMkTg/discussion – Discussion on the cantera users‘ group about reaction path diagram
- http://www.graphviz.org/Documentation.php – Graphviz documentation
- http://www.graphviz.org/pdf/dotguide.pdf – Dot layout commands
- http://www.graphviz.org/content/arrow-shapes Page about arrow shapes in the dot docs
- http://hslpicker.com/ – Color picker for hue, saturation, lightness color values.
- http://www.graphviz.org/content/attrs#kstyle Docs about the style attribute for dot.
The tutorial is very helpful. Thanks to you.
1. Is it possible to write a loop in concentration terms rather than in temperature?
2. It is unclear in regard to what concentration the reaction path analysis is carried out?
Hi Nitin,
I am not sure if I understand what you mean. The reaction path analysis is carried out in terms of kmol/m³s of species forming or dissipating. The concentration before the reaction is set by yourself and it can be monitored while the reaction takes place. You can write loops for any value that you can monitor, so yes, you could write a loop for concentration, too. The loop used in the example is just arbitrary to have some reaction taking place, the focus here was on the reaction path.
Thank you for a very clear and detailed tutorial! I am just starting to dabble into Cantera and I was drawn to it primarily due to this reaction network capability for use in microkinetic modeling.
Tutorial is great! I am implementing some of your tips in my Cantera based parametric PFR with approximate heat transfer to provide an automatic reaction path at each discrete position. Please let me know if you wish to receive the final code.
I am not actively working with cantera at the moment, but there may be other that could be interested in your solution. During my master thesis I discussed with my colleague if it is possible to generate reaction path diagrams in fine steps that you not only have the current net flows but sum it up to the total flows over a certain period of time. What you are doing may lead to such a solution, that would definitely something people are interested in.
The tutorial is of great help. I’m wondering if you also know how to output a species‘ production rate and/destruction rate with respect to the reactions that consuming or producing it. If your have not idea on it. Thank you all the same.
Dear Tilman,
this is an amazing tutorial and very useful for all of us, students and researchers, using cantera.
Thank you so much for sharing and for your effort.
Leonidas
Dear Tilman,
Great tutorial.
Do you know how to get reaction path diagram after flame formation front of a 1D free flame?
Kind regards
Hi Tilman
This is indeed a really nice tutorial -- to make it less obscure, I opened a ‚feature request‘ to include an improved tutorial (perhaps based on this work?) on the official cantera pages here: https://github.com/Cantera/enhancements/issues/95 -- it would be great if you could respond there, thanks!
I think it is a good idea, but I am not working with cantera anymore (and I don’t even know what Jupyter is :-). I knew I wouldn’t be involved in it after my thesis, so I made sure to write down everything when I still knew it. I know this is not ideal, but at least I contributed a little bit, but I won’t be able to help going forward, unfortunately.
So thank you anyway for your message and for crediting me and of course I hope my work was helpful to you!
Thank you, Tilman! … not too surprising that you’re no longer working on this (it’s been a while since you put this together), but I thought it was a great resource. Hopefully some of what you posted here will make it into the documentation eventually.
Thank you for the tutorial, it helps me a lot!
Amazing tutorial. Thank you for sharing!
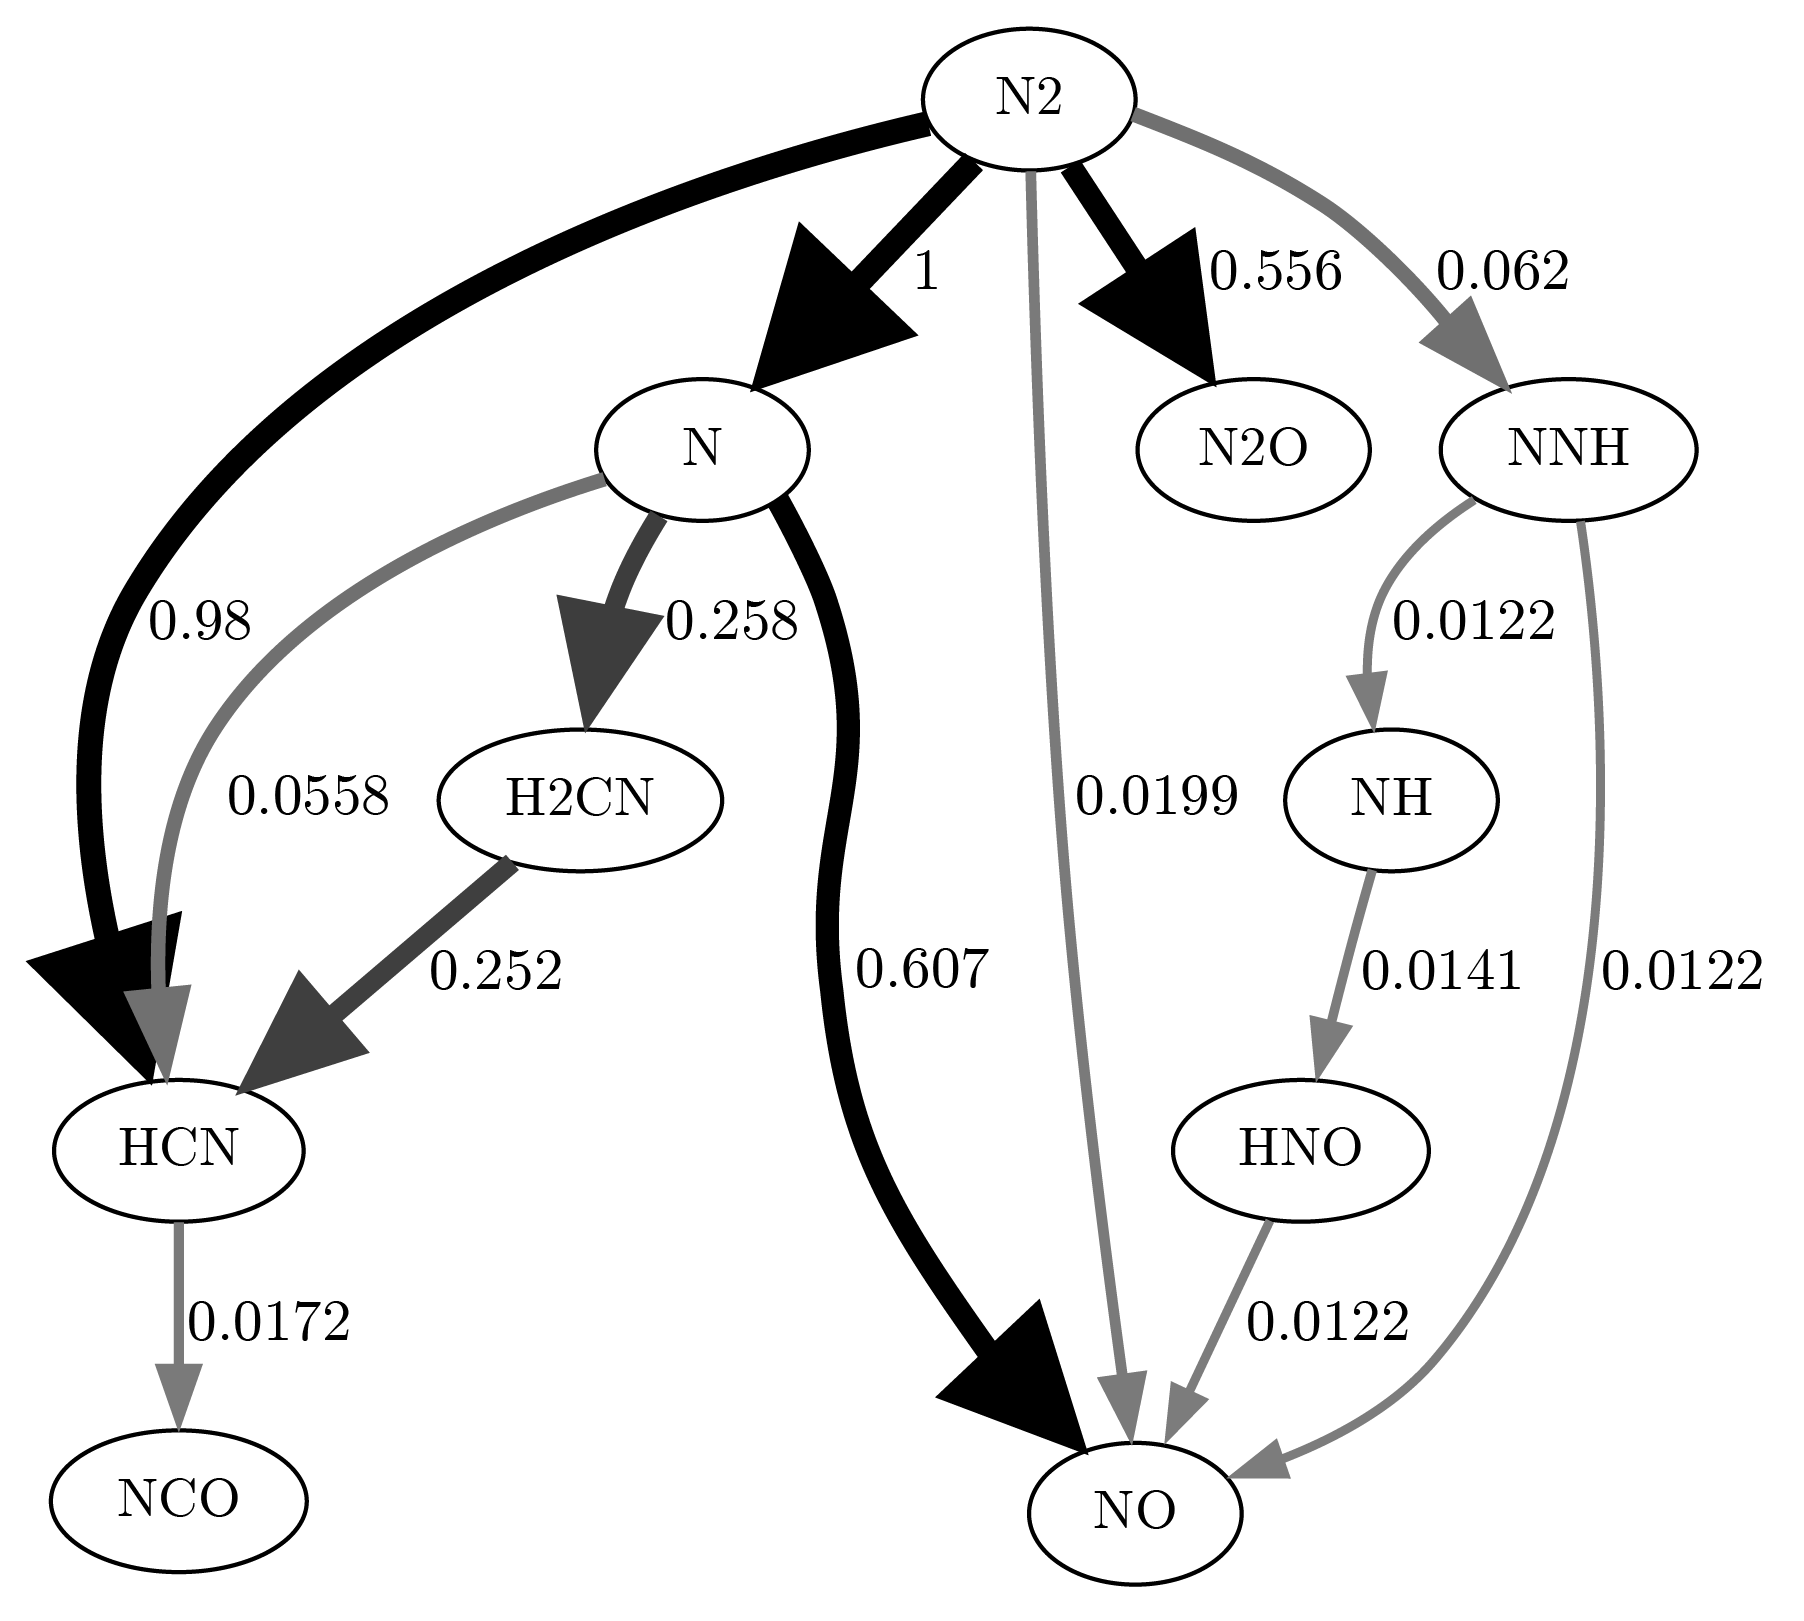
I had a question relating the first N2 diagram. So, you setted up the gas temperature, pressure and composition and stated that you wanted to follow N.
I am not clear on what you are showing. Is it that N2 reacts with CH4 to form NNH? Does the 1 means the reaction rate?
Thanks again for sharing this amazing article!
The diagram simply shows where the N ends up, but it doesn’t show the reaction. These are normalized reaction rates, so 1 is the biggest one. I believe there is an option to show real reaction rates, but I worked with cantera 5 years ago so I am not sure anymore.
Thank you very much. It is so helpful.